SpringBoot Application의 monitoring 시스템 구축하기
Spring Boot를 사용하고 있는 애플리케이션에서 이전에 살펴본 Micrometer를 이용해서 metric을 생성하고 Prometheus를 이용해 수집, 그리고 Grafana로 시각화하는 시스템을 만들어보자.
Prometheus는 metric을 수집하고 모니터링 및 알람에 사용되는 오픈소스 애플리케이션이다. time series database를 사용해 metric을 저장하고 flexible한 query를 사용하 metric을 조회할 수 있다.
Grafana는 데이터 시각화, 모니터링 및 분석을 위한 오픈소스 플랫폼이다. 사용자는 Grafana에서 패널(panel)을 사용해 설정된 기간 동안 특정 metric을 나타내는 dashboard를 만들 수 있다.
Grafana는 그래프, 테이블 같은 것들을 지원할 뿐만 아니라 시각화를 위한 별도의 플러그인을 추가해서 사용할 수도 있다.
Spring Boot Dependency
Spring Boot 2.0 이상부터는 애플리케이션의 metric 측정을 위해서 Micrometer를 제공한다. Micrometer는 Spring Boot 2의 Actuator에 포함되어 있기 때문에 spring-boot-starter-actuator를 dependency에 추가해주면 쉽게 사용할 수 있다.
추가적으로 micrometer-registry-prometheus dependency가 필요하다. 이 dependency는 Micrometer가 만들어내는 metric을 Prometheus 서버에서 사용할 수 있는 metric format으로 변경한다.
1 | dependencies { |
Actuator Endpoint 설정
Actuator는 Spring MVC 혹은 Spring WebFlux를 사용하는 경우, Micrometer를 통해 생성된 애플리케이션의 metric을 Prometheus 서버에서 가져갈(Pull)수 있도록 추가적인 endpoint를 제공해준다.
Spring Boot 2.0 이상부터 사용하는 Actuator는 1.x 버전에서 사용하던 것과는 달리 대부분의 endpoint가 disabled로 설정되어 있다. 기본적으로 /health와 /info 2가지 endpoint만 default로 사용 가능하다. 따라서 /Prometheus endpoint를 사용할 수 있도록 다음과 같이 application.yml에서 설정이 필요하다.
1 | management: |
애플리케이션을 실행하고 http://localhost:8080/actuator 를 통해 Actuator가 제공하는 endpoint들을 확인할 수 있다.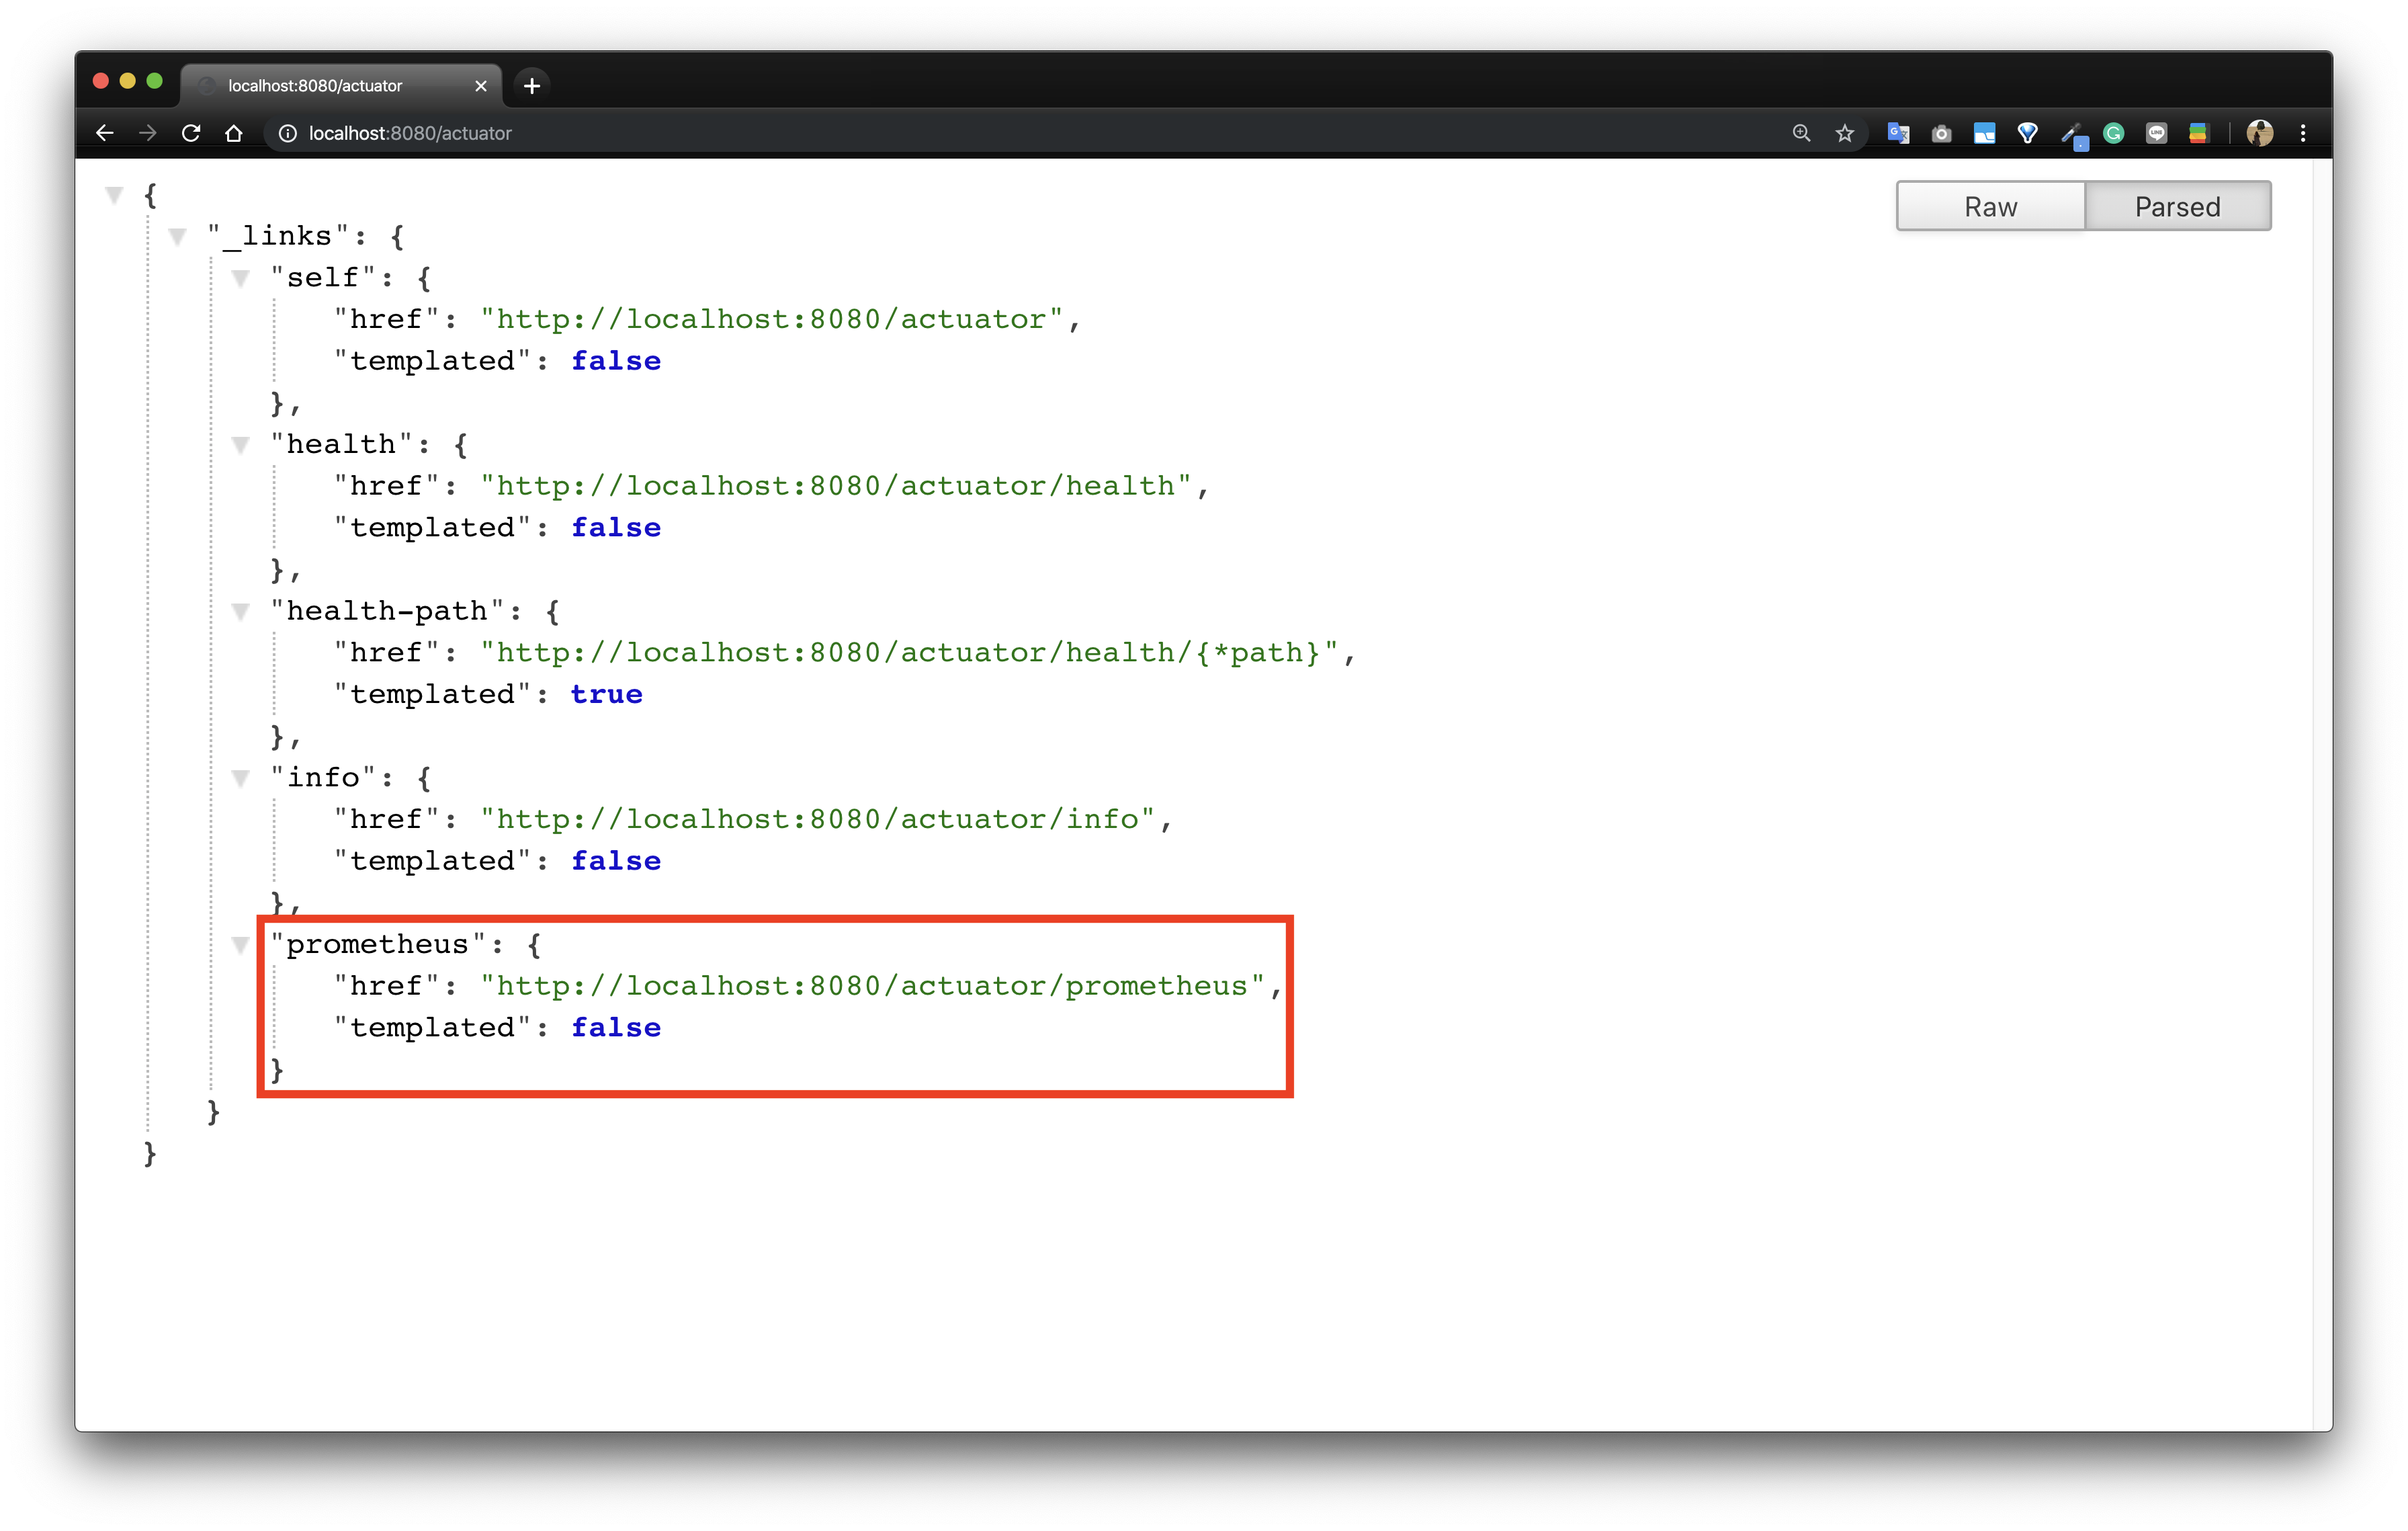
http://localhost:8080/actuator/prometheus 에서는 Micrometer를 통해 수집된 metric들을 확인할 수 있다.
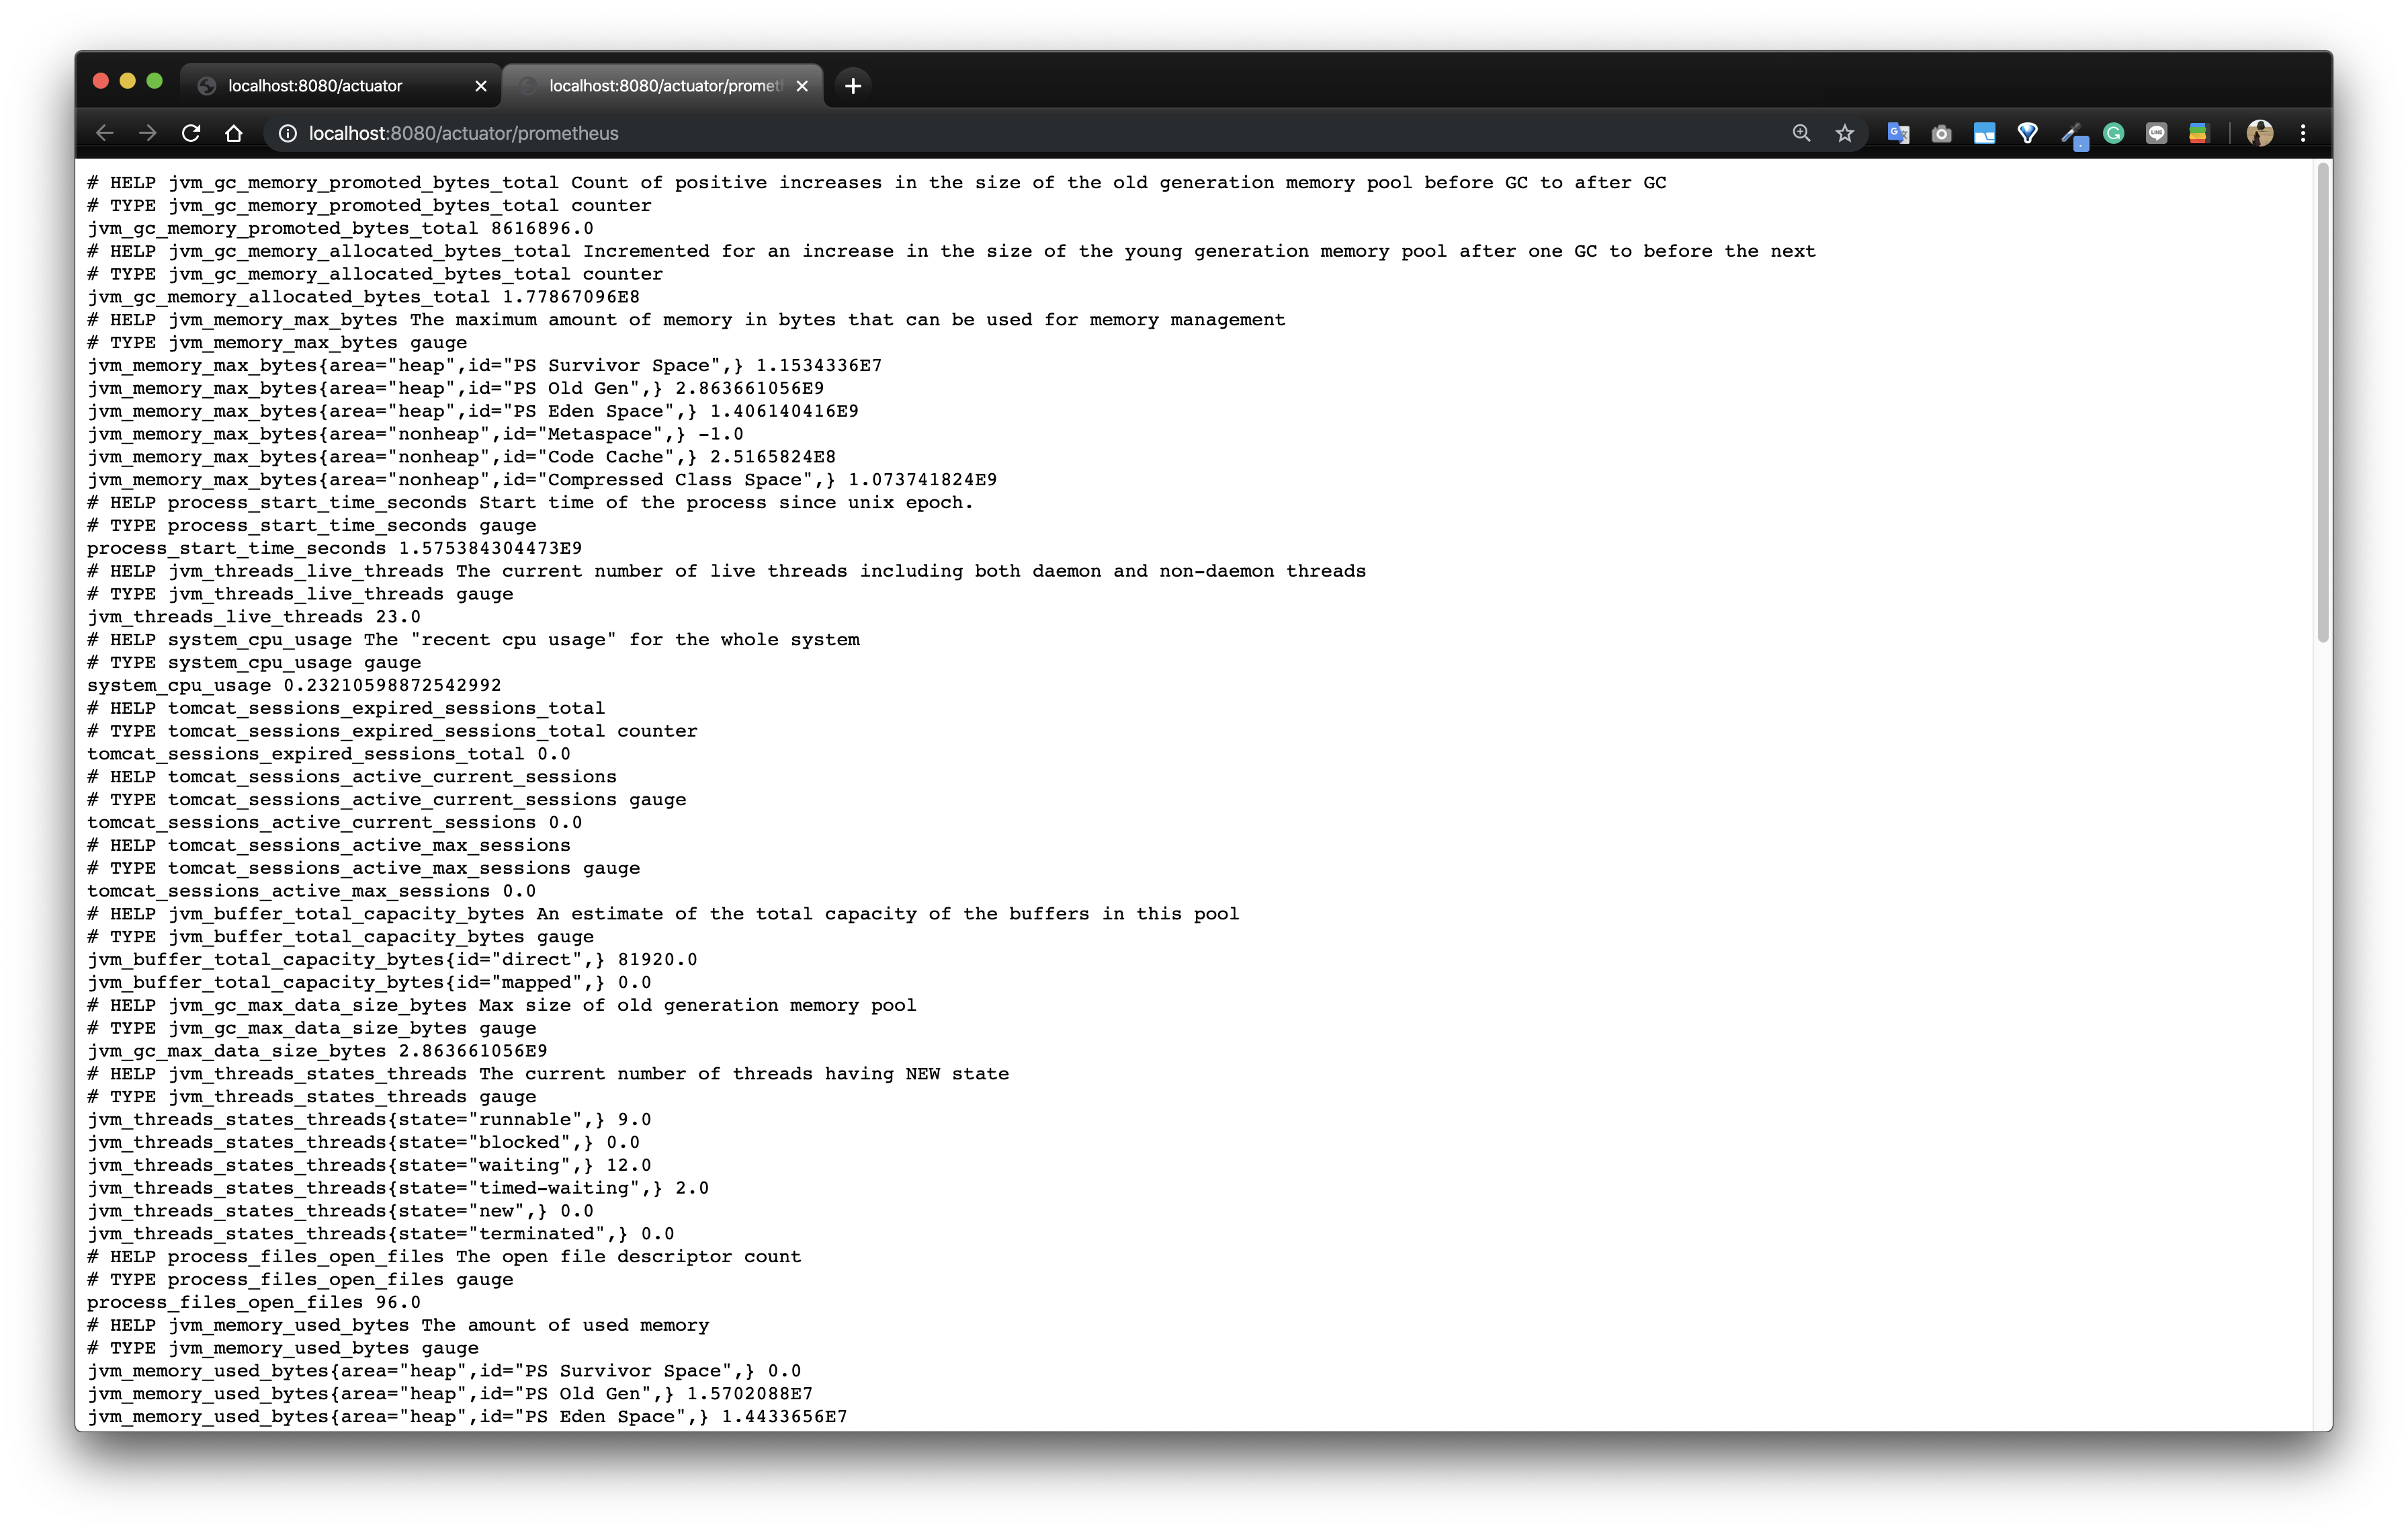
Spring Boot 2는 기본적으로 다음과 같은 metric들을 제공하고 있다.
- JVM, report utilization of:
- Various memory and buffer pools
- Statistics related to garbage collection
- Thread utilization
- Number of classes loaded/unloaded
- CPU usage
- Spring MVC and WebFlux request latencies
- RestTemplate latencies
- Cache utilization
- Datasource utilization, including HikariCP pool metrics
- RabbitMQ connection factories
- File descriptor usage
- Logback: record the number of events logged to Logback at each level
- Uptime: report a gauge for uptime and a fixed gauge representing the application’s absolute start time
- Tomcat usage
Prometheus 설치 및 설정
애플리케이션에서의 설정은 끝났으니 애플리케이션에서 생성하는 metric을 수집하기 위한 Prometheus Server를 준비해보자.
테스트를 할 때는 역시나 docker(prometheus image)를 이용하면 간편하다. 만약 실제 로컬 환경 혹은 별도의 서버 환경에서 설치해서 사용하고 싶다면 https://prometheus.io/download/#prometheus 에서 다운받아 설치하자.
Prometheus Server는 기동시 /etc/prometheus/prometheus.yml 설정 파일을 사용한다. docker volume mount를 이용해 Prometheus Server에서 사용할 설정 prometheus.yml 파일을 만들어보자.
1 | global: |
docker에서
host.docker.internal은 특별한 DNS name으로 사용되며 docker를 실행하는 host를 가리킨다. 개발용으로만 사용해야 하며, Docker Desktop(Mac) 외부의 환경에서는 동작하지 않는다.
파일 생성을 완료했다면 prom/prometheus 이미지를 이용해 docker로 prometheus를 실행한다.
1 | $ pwd |
문제 없이 실행되었다면 http://localhost:9090 에 접속해보자. 다음과 같이 Prometheus main 화면을 볼 수 있다.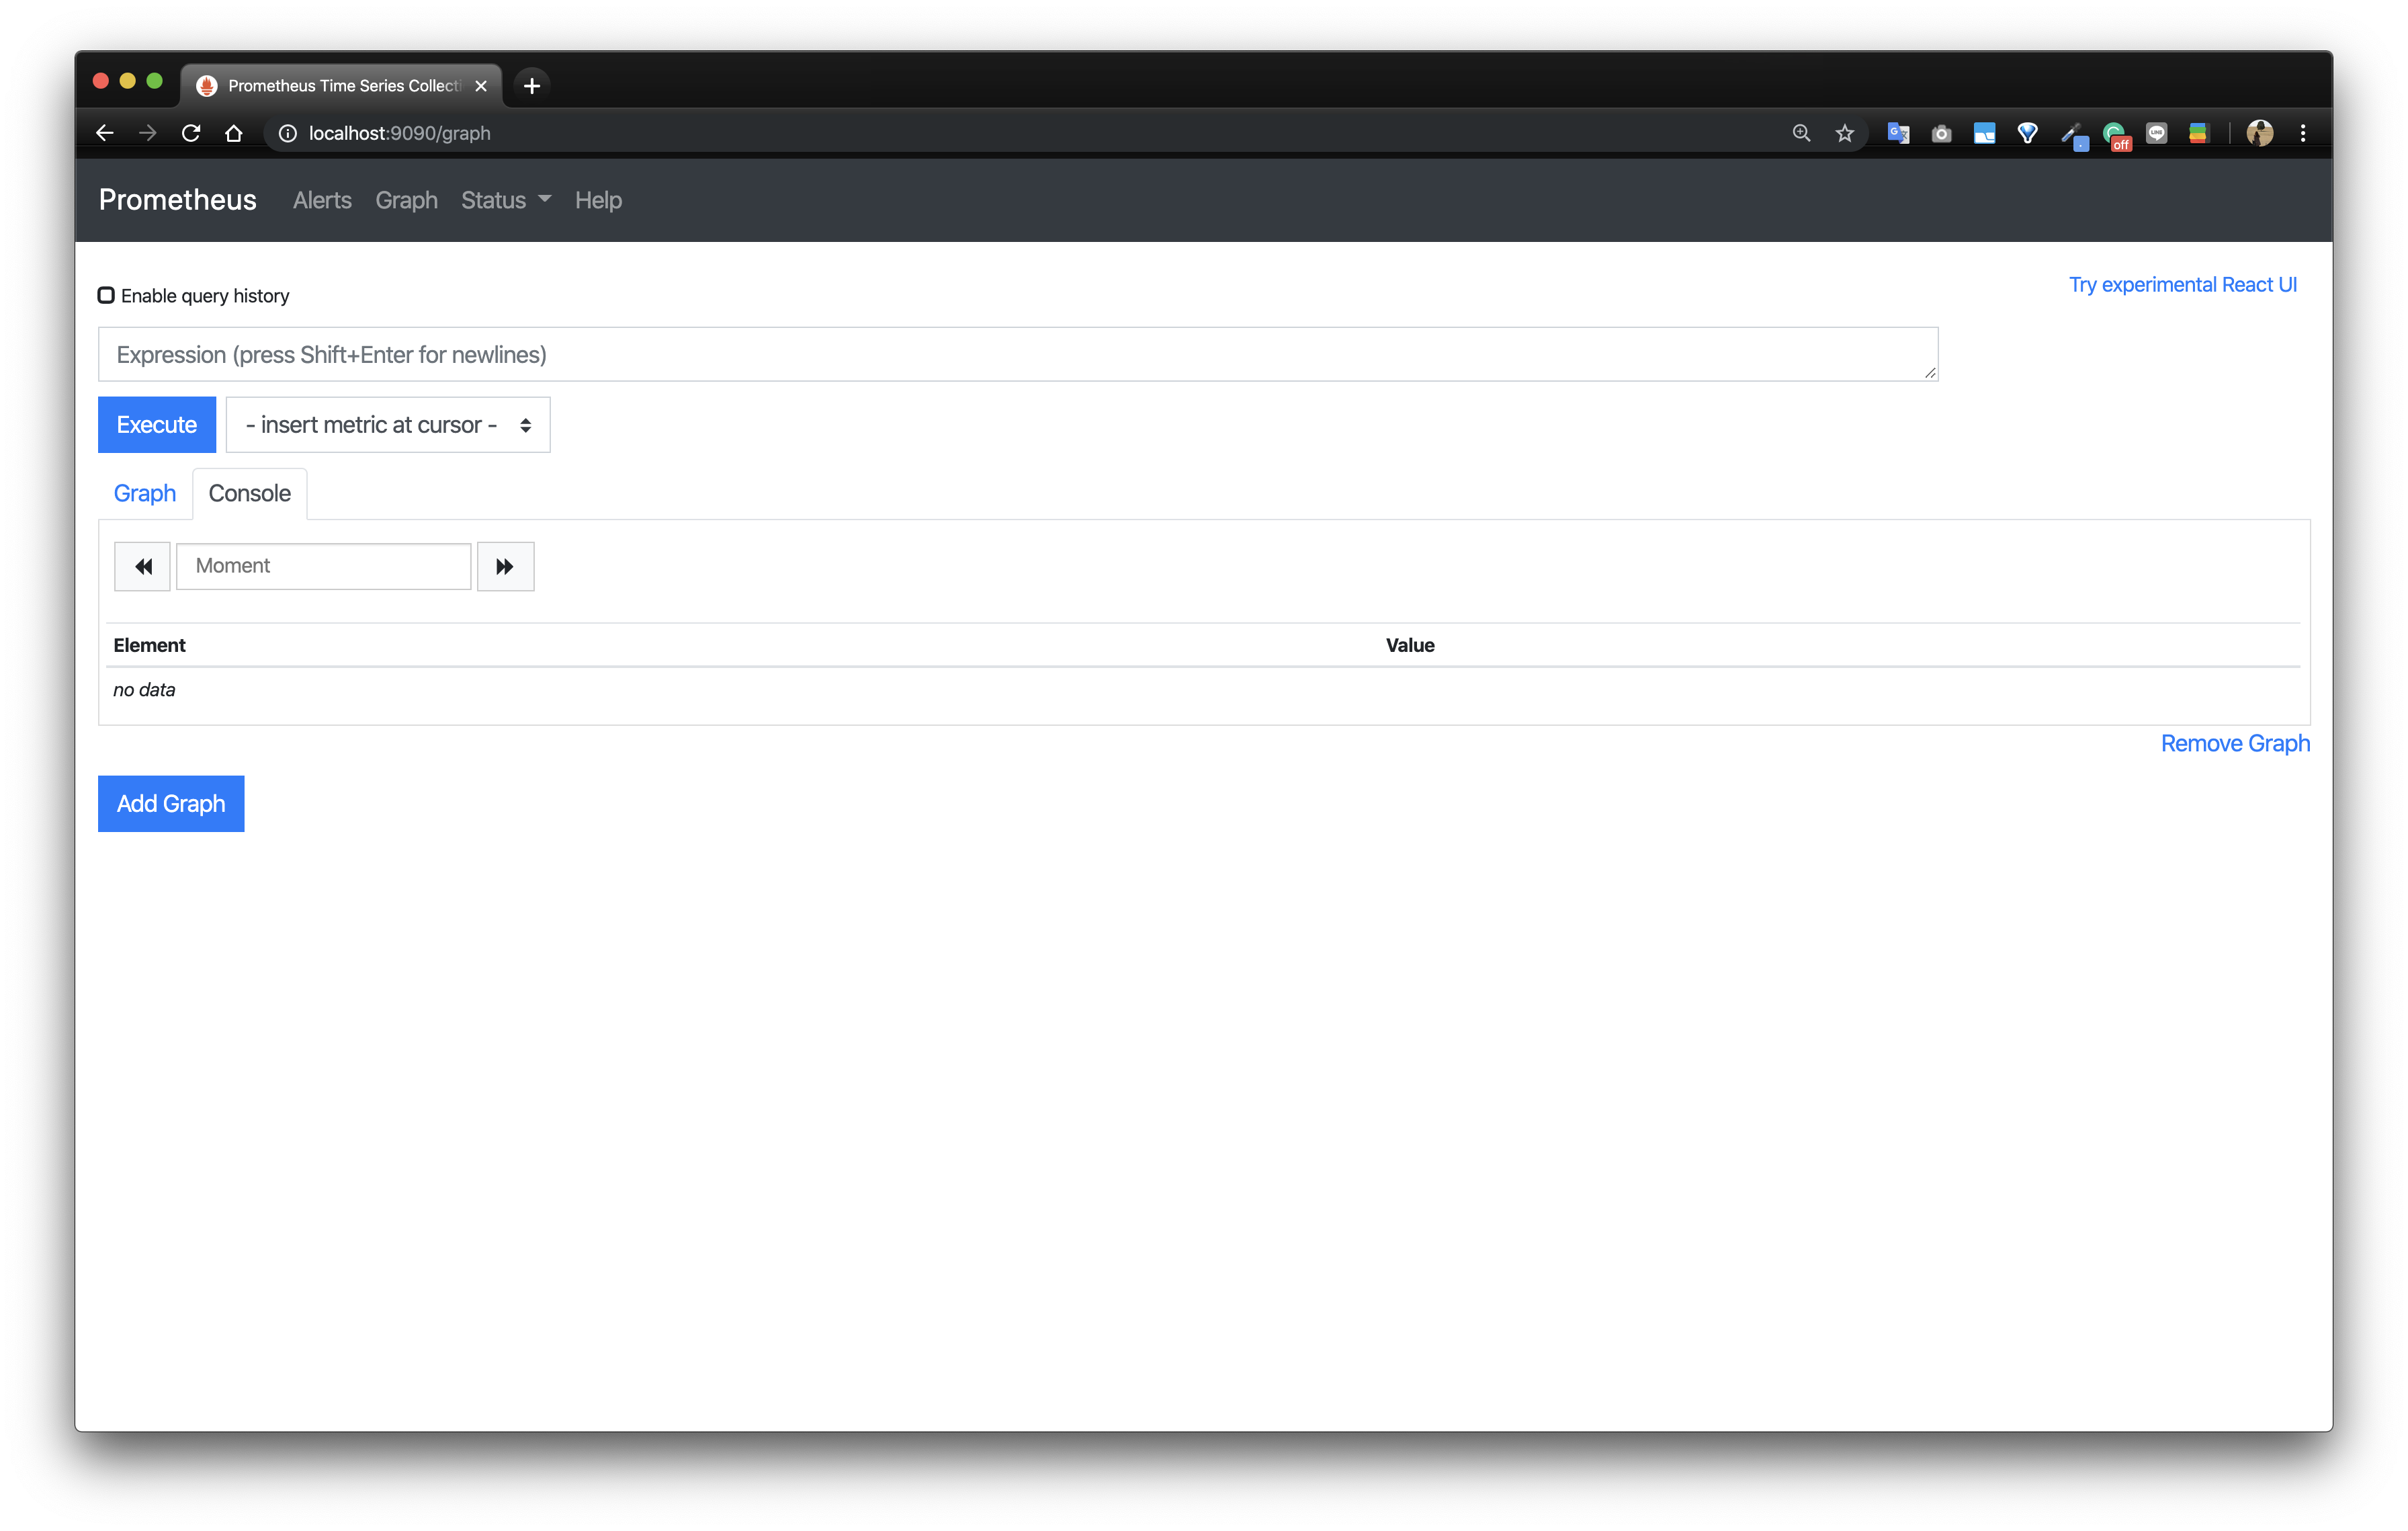
docker로 Prometheus를 실행하면서 설정 파일이 잘 적용되었는지도 확인해보자.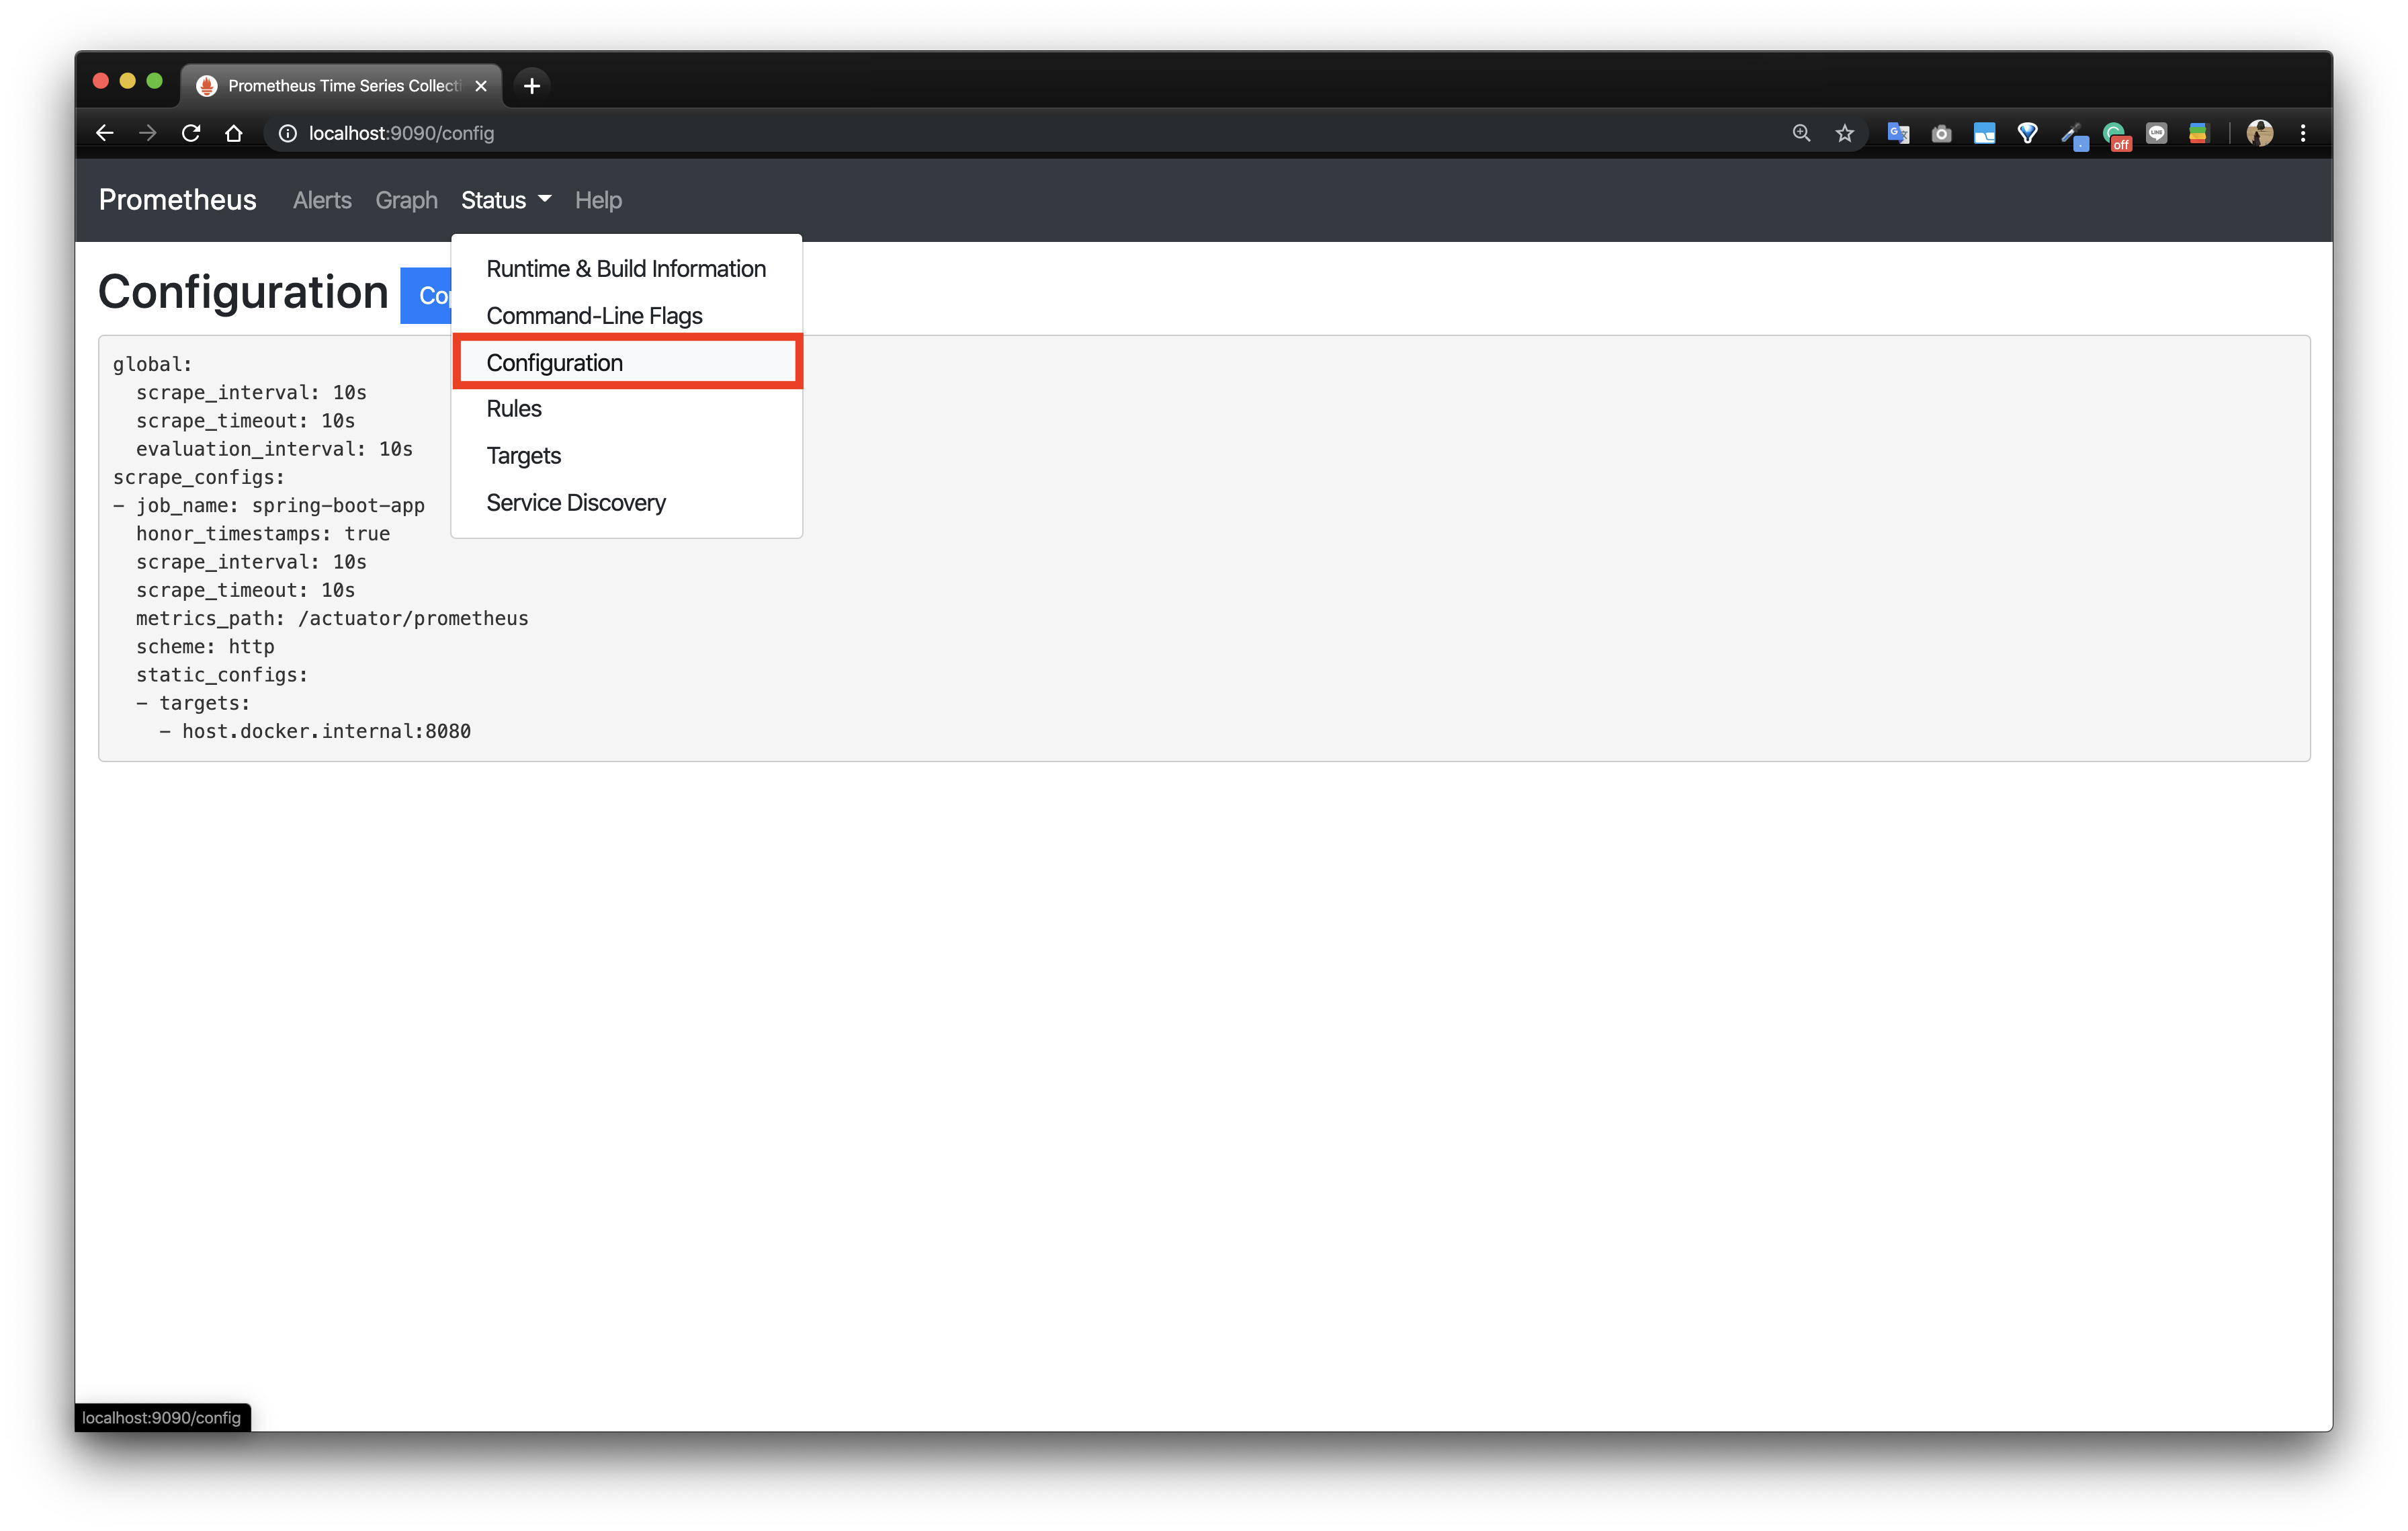
Status -> Targets 메뉴에서는 Application의 상태를 확인할 수 있다.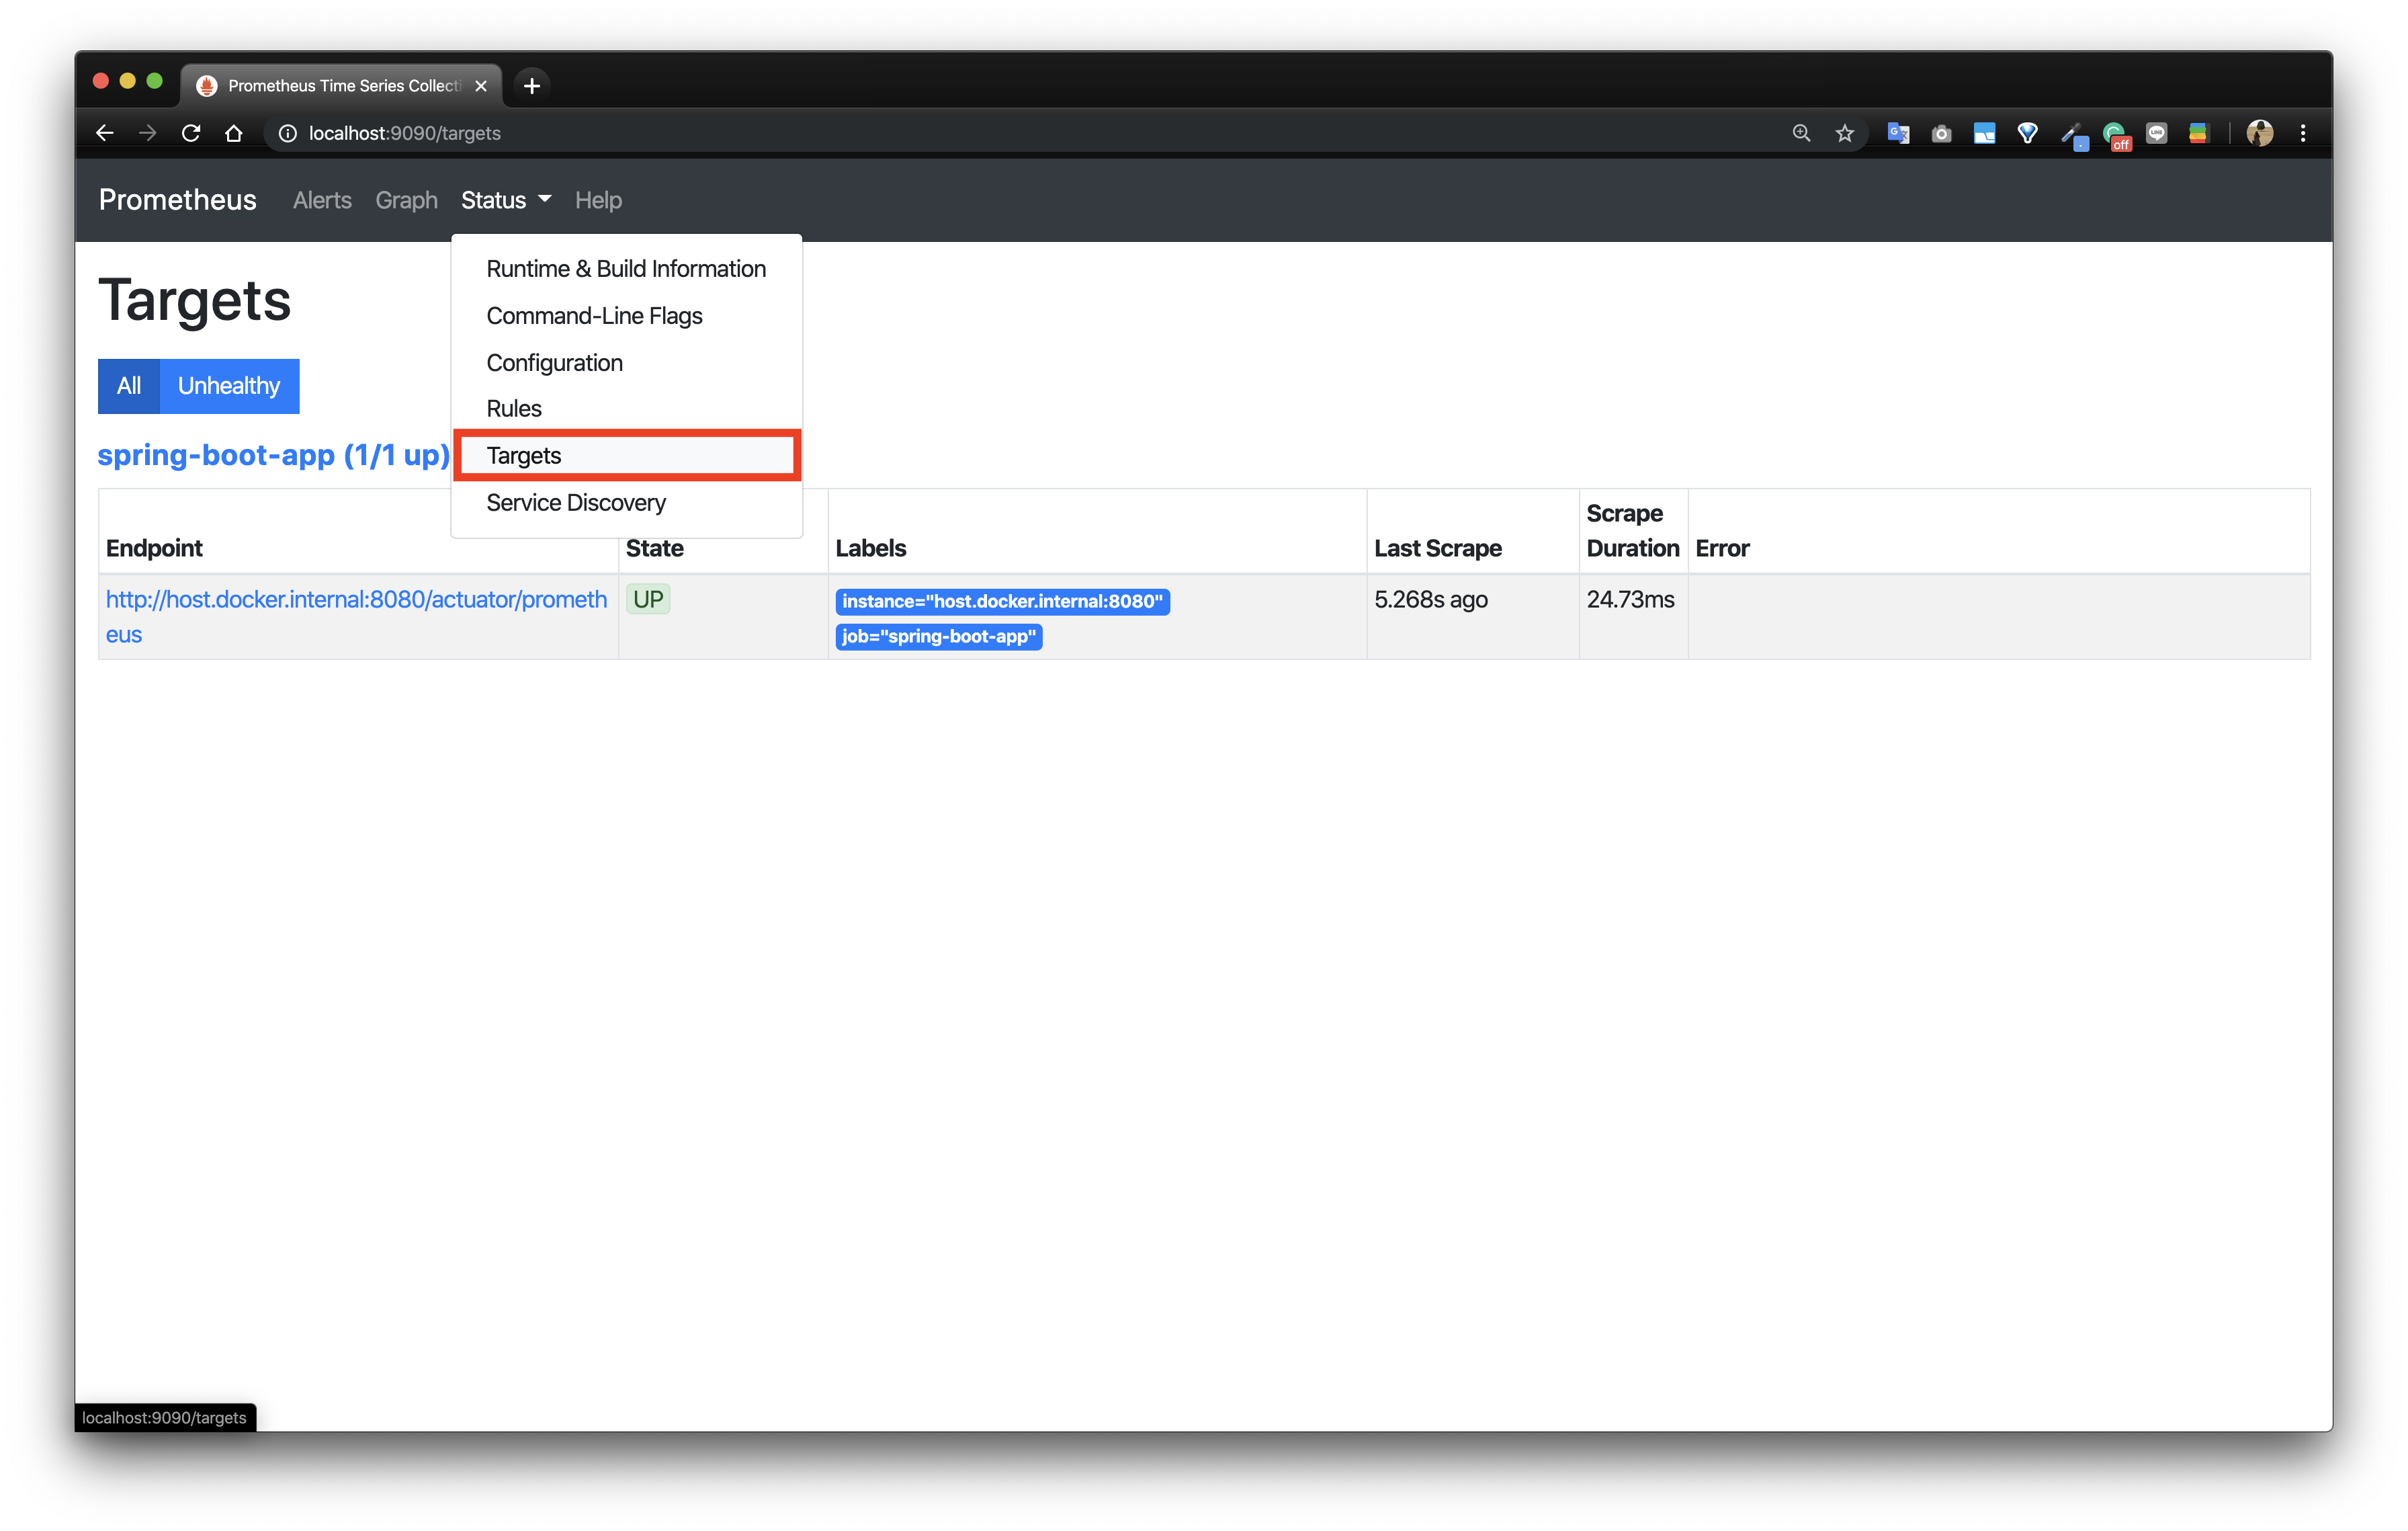
Application의 상태(Status)가 DOWN인 경우에는 Application이 현재 기동중인지, prometheus.yml에서 targets의 값이 제대로 되어있는지 확인이 필요하다.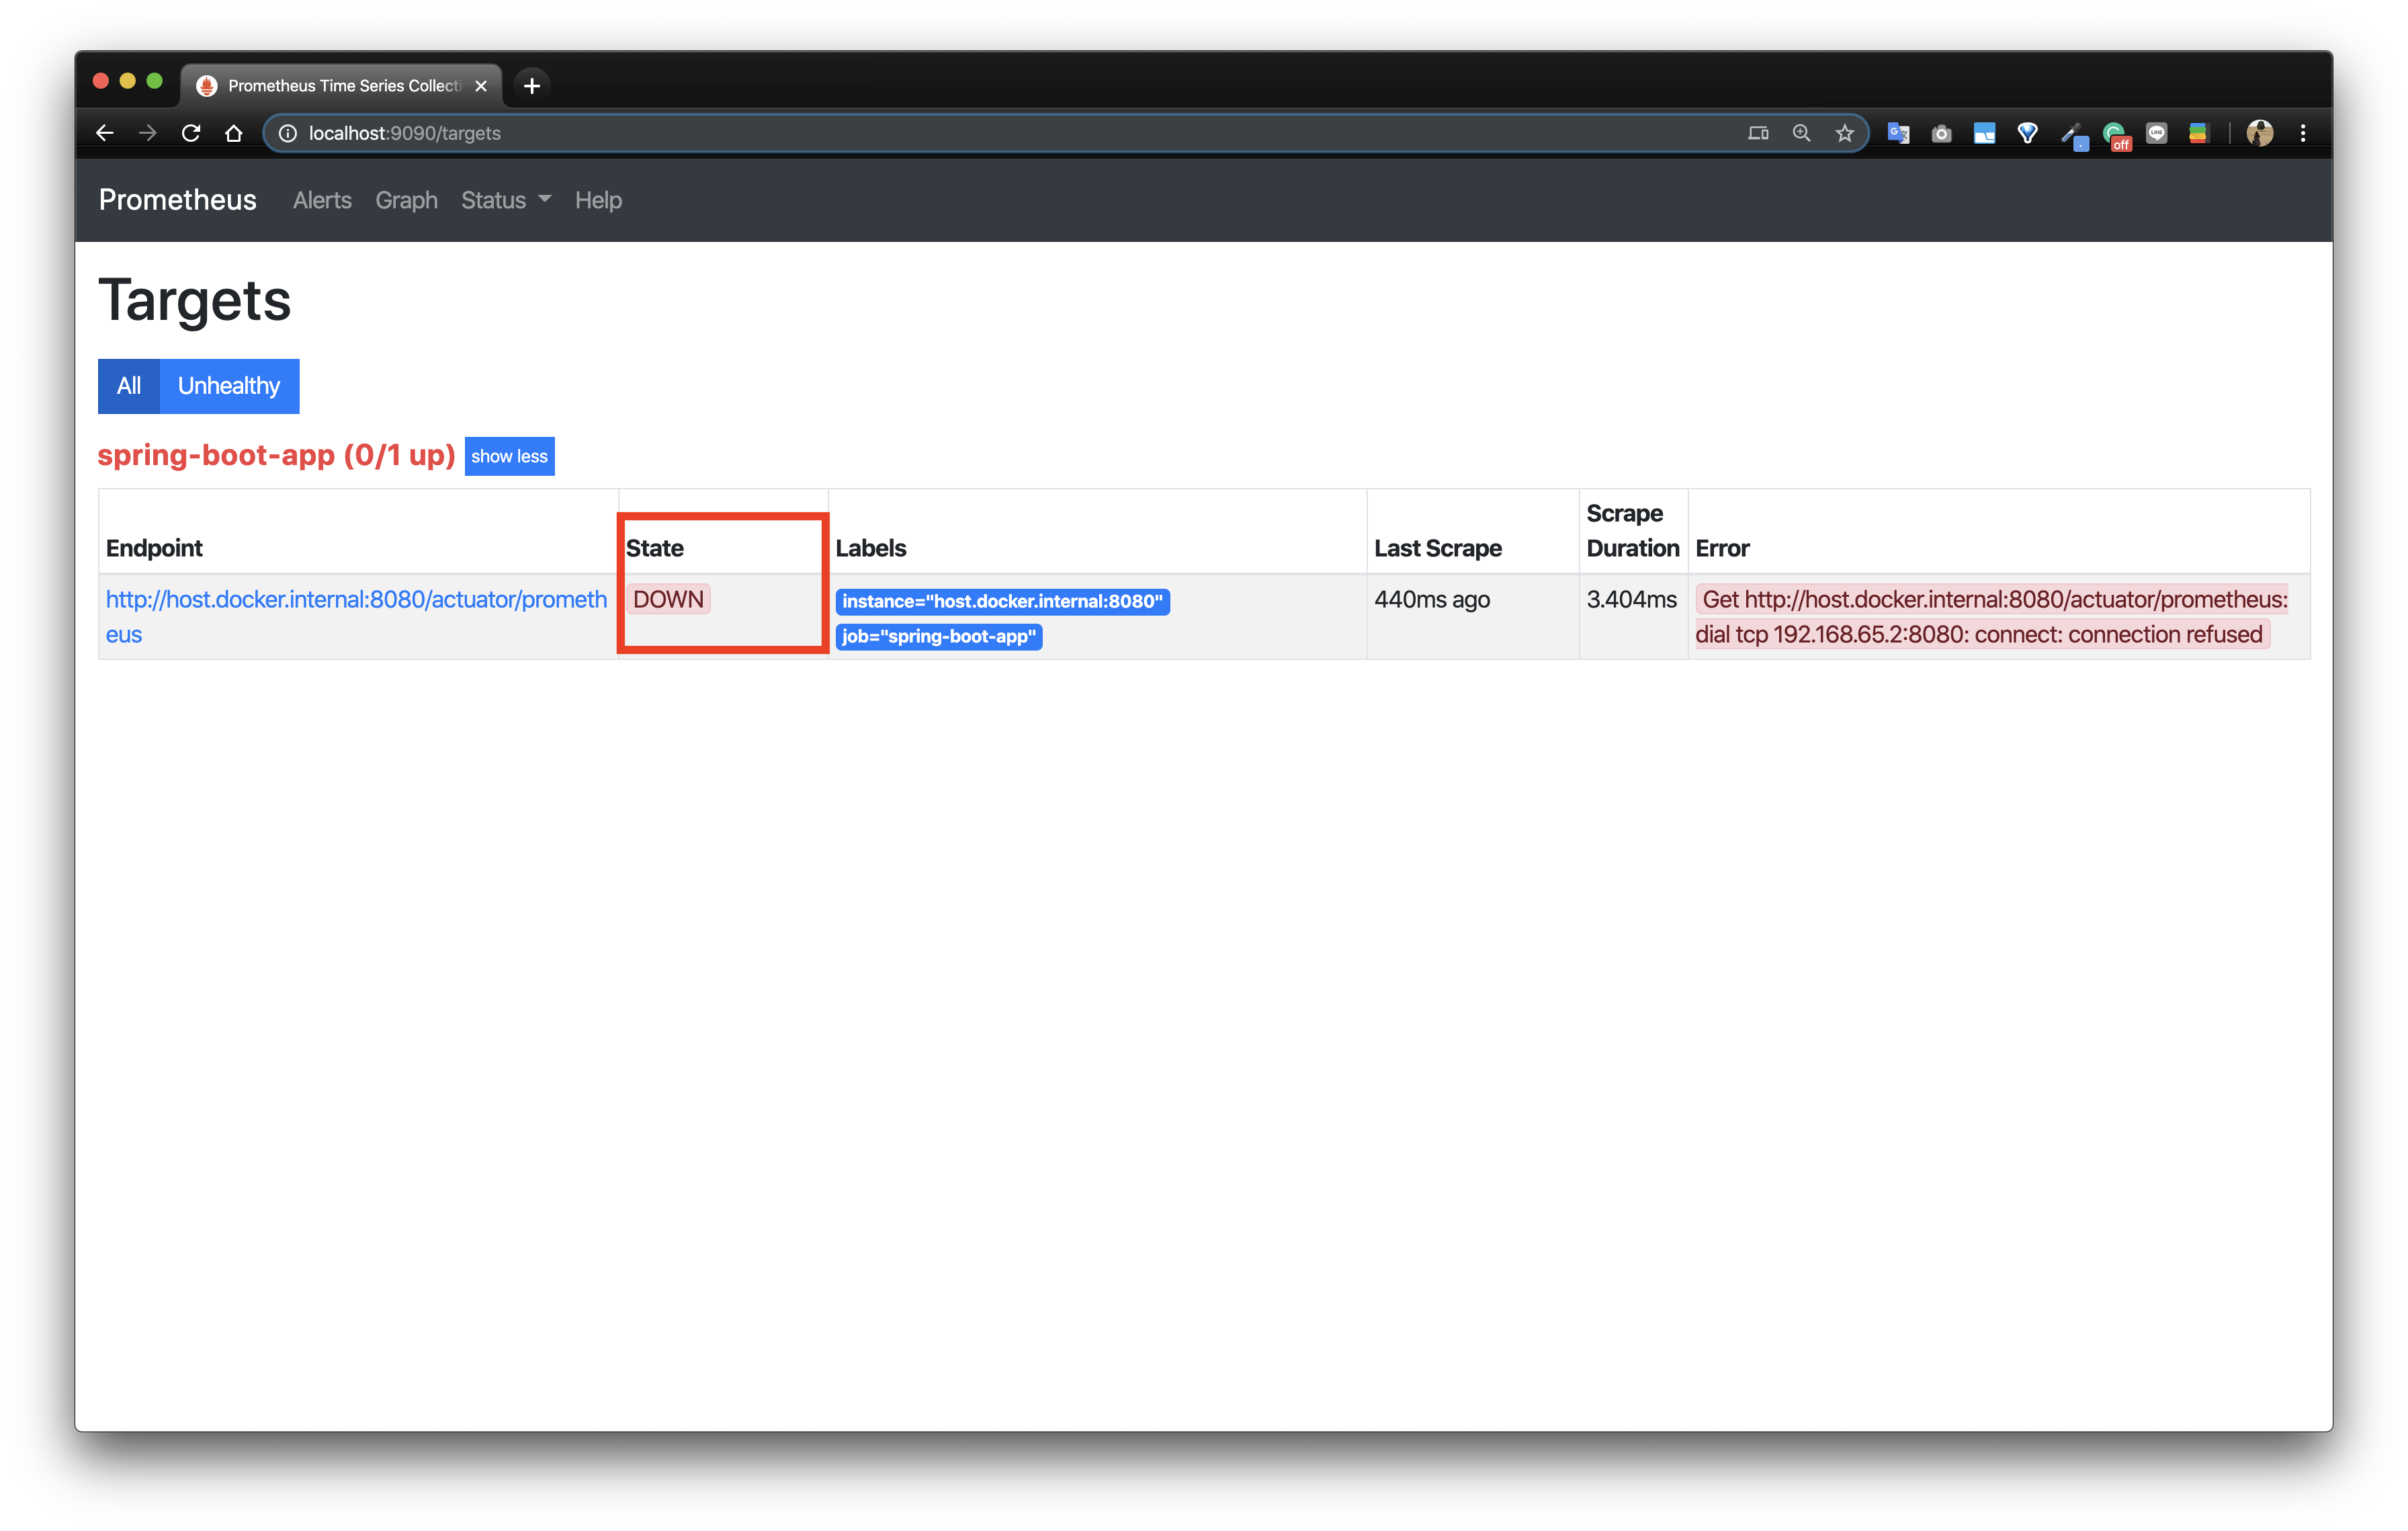
여기까지 문제가 없다면 아래와 같이 수집된 metric 중 하나를 선택해 값이 잘 나오는지 확인해보자.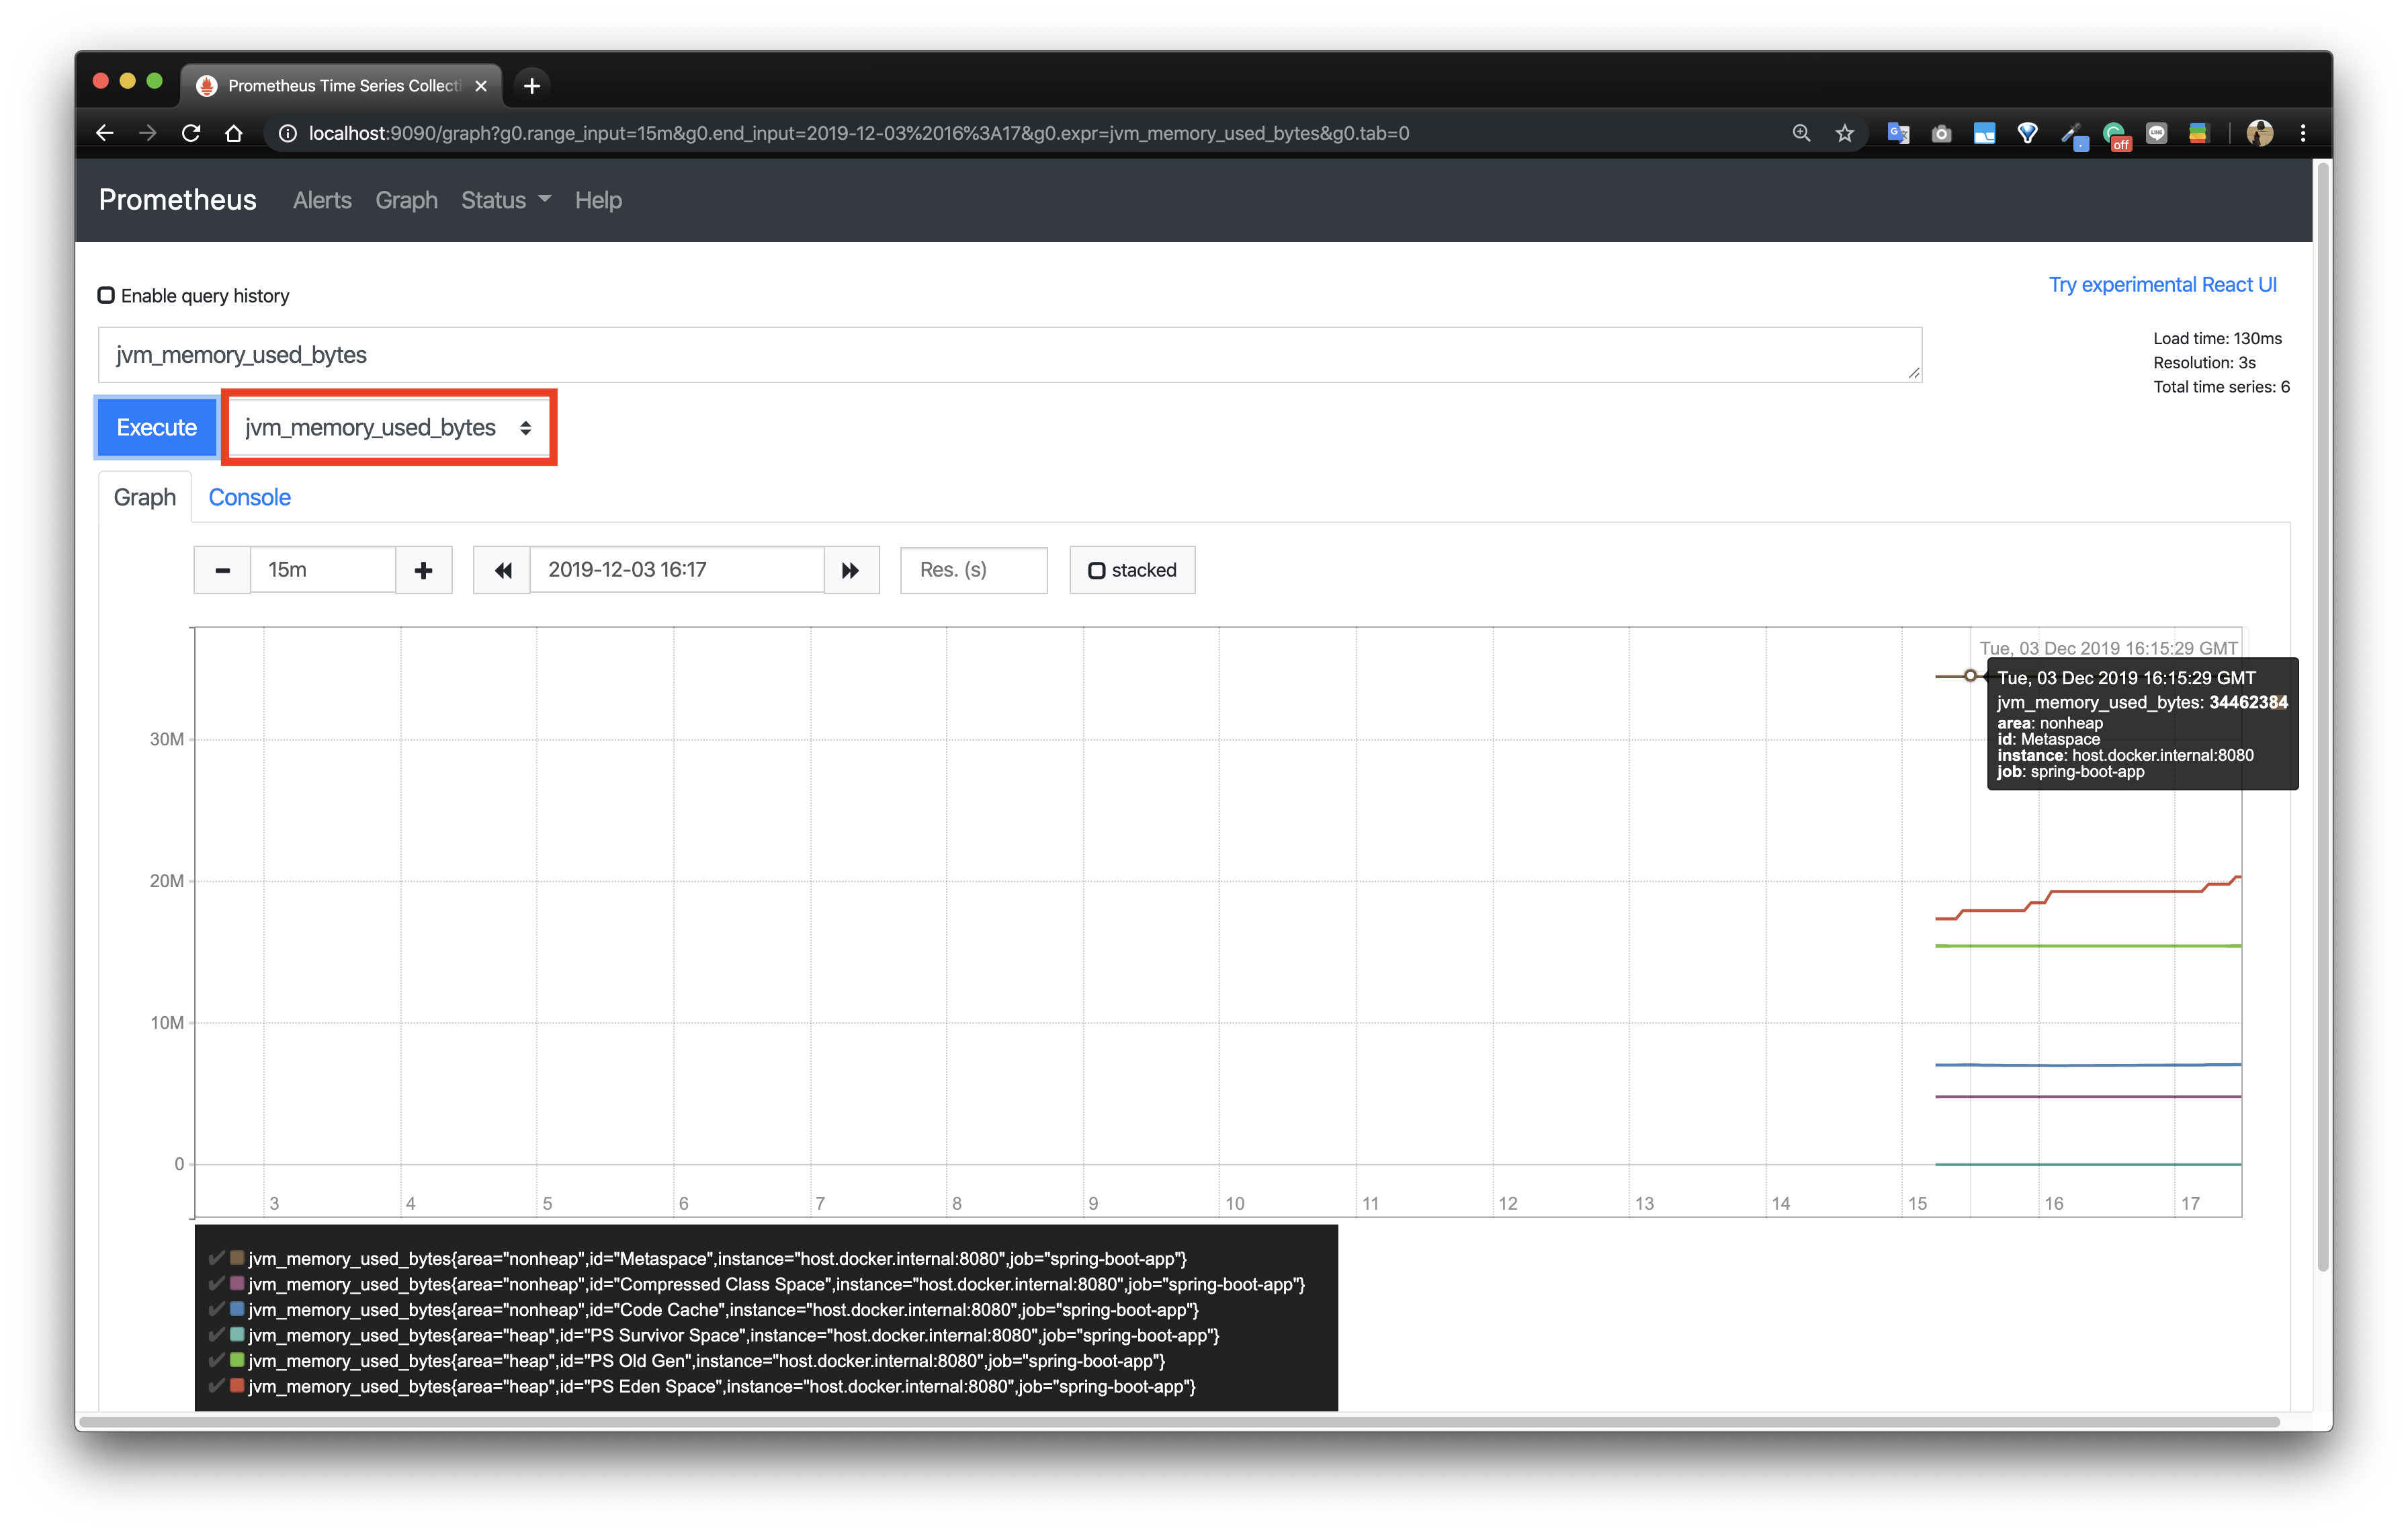
Prometheus에서 수집한 metric을 Grafana로 시각화하기
Prometheus의 웹 페이지에서 쿼리를 실행해 원하는 metric을 그래프로 시각화할 수 있다. 하지만 매번 모니터링을 위해 수동으로 쿼리를 실행하는 것은 비효율적이고 기본적으로 제공하는 대시보드 또한 간단하게 그래프를 볼 수 있는 정도이다.
Prometheus가 제공하는 것만으로는 시각화하는데 한계가 있기 때문에 보통 별도의 시각화 도구를 이용해서 metric들을 모니터링한다.
이번에는 별도의 시각화 도구로 Grafana를 사용해보자. 역시나 docker(grafana/grafana)를 사용한다.
1 | $ docker run -d --name=grafana -p 3000:3000 grafana/grafana |
실행 후 http://localhost:3000 에 접속해보자. 다음과 같이 Grafana login 화면을 볼 수 있다.
기본 설정된 ID/PW인 admin/admin 으로 로그인할 수 있다.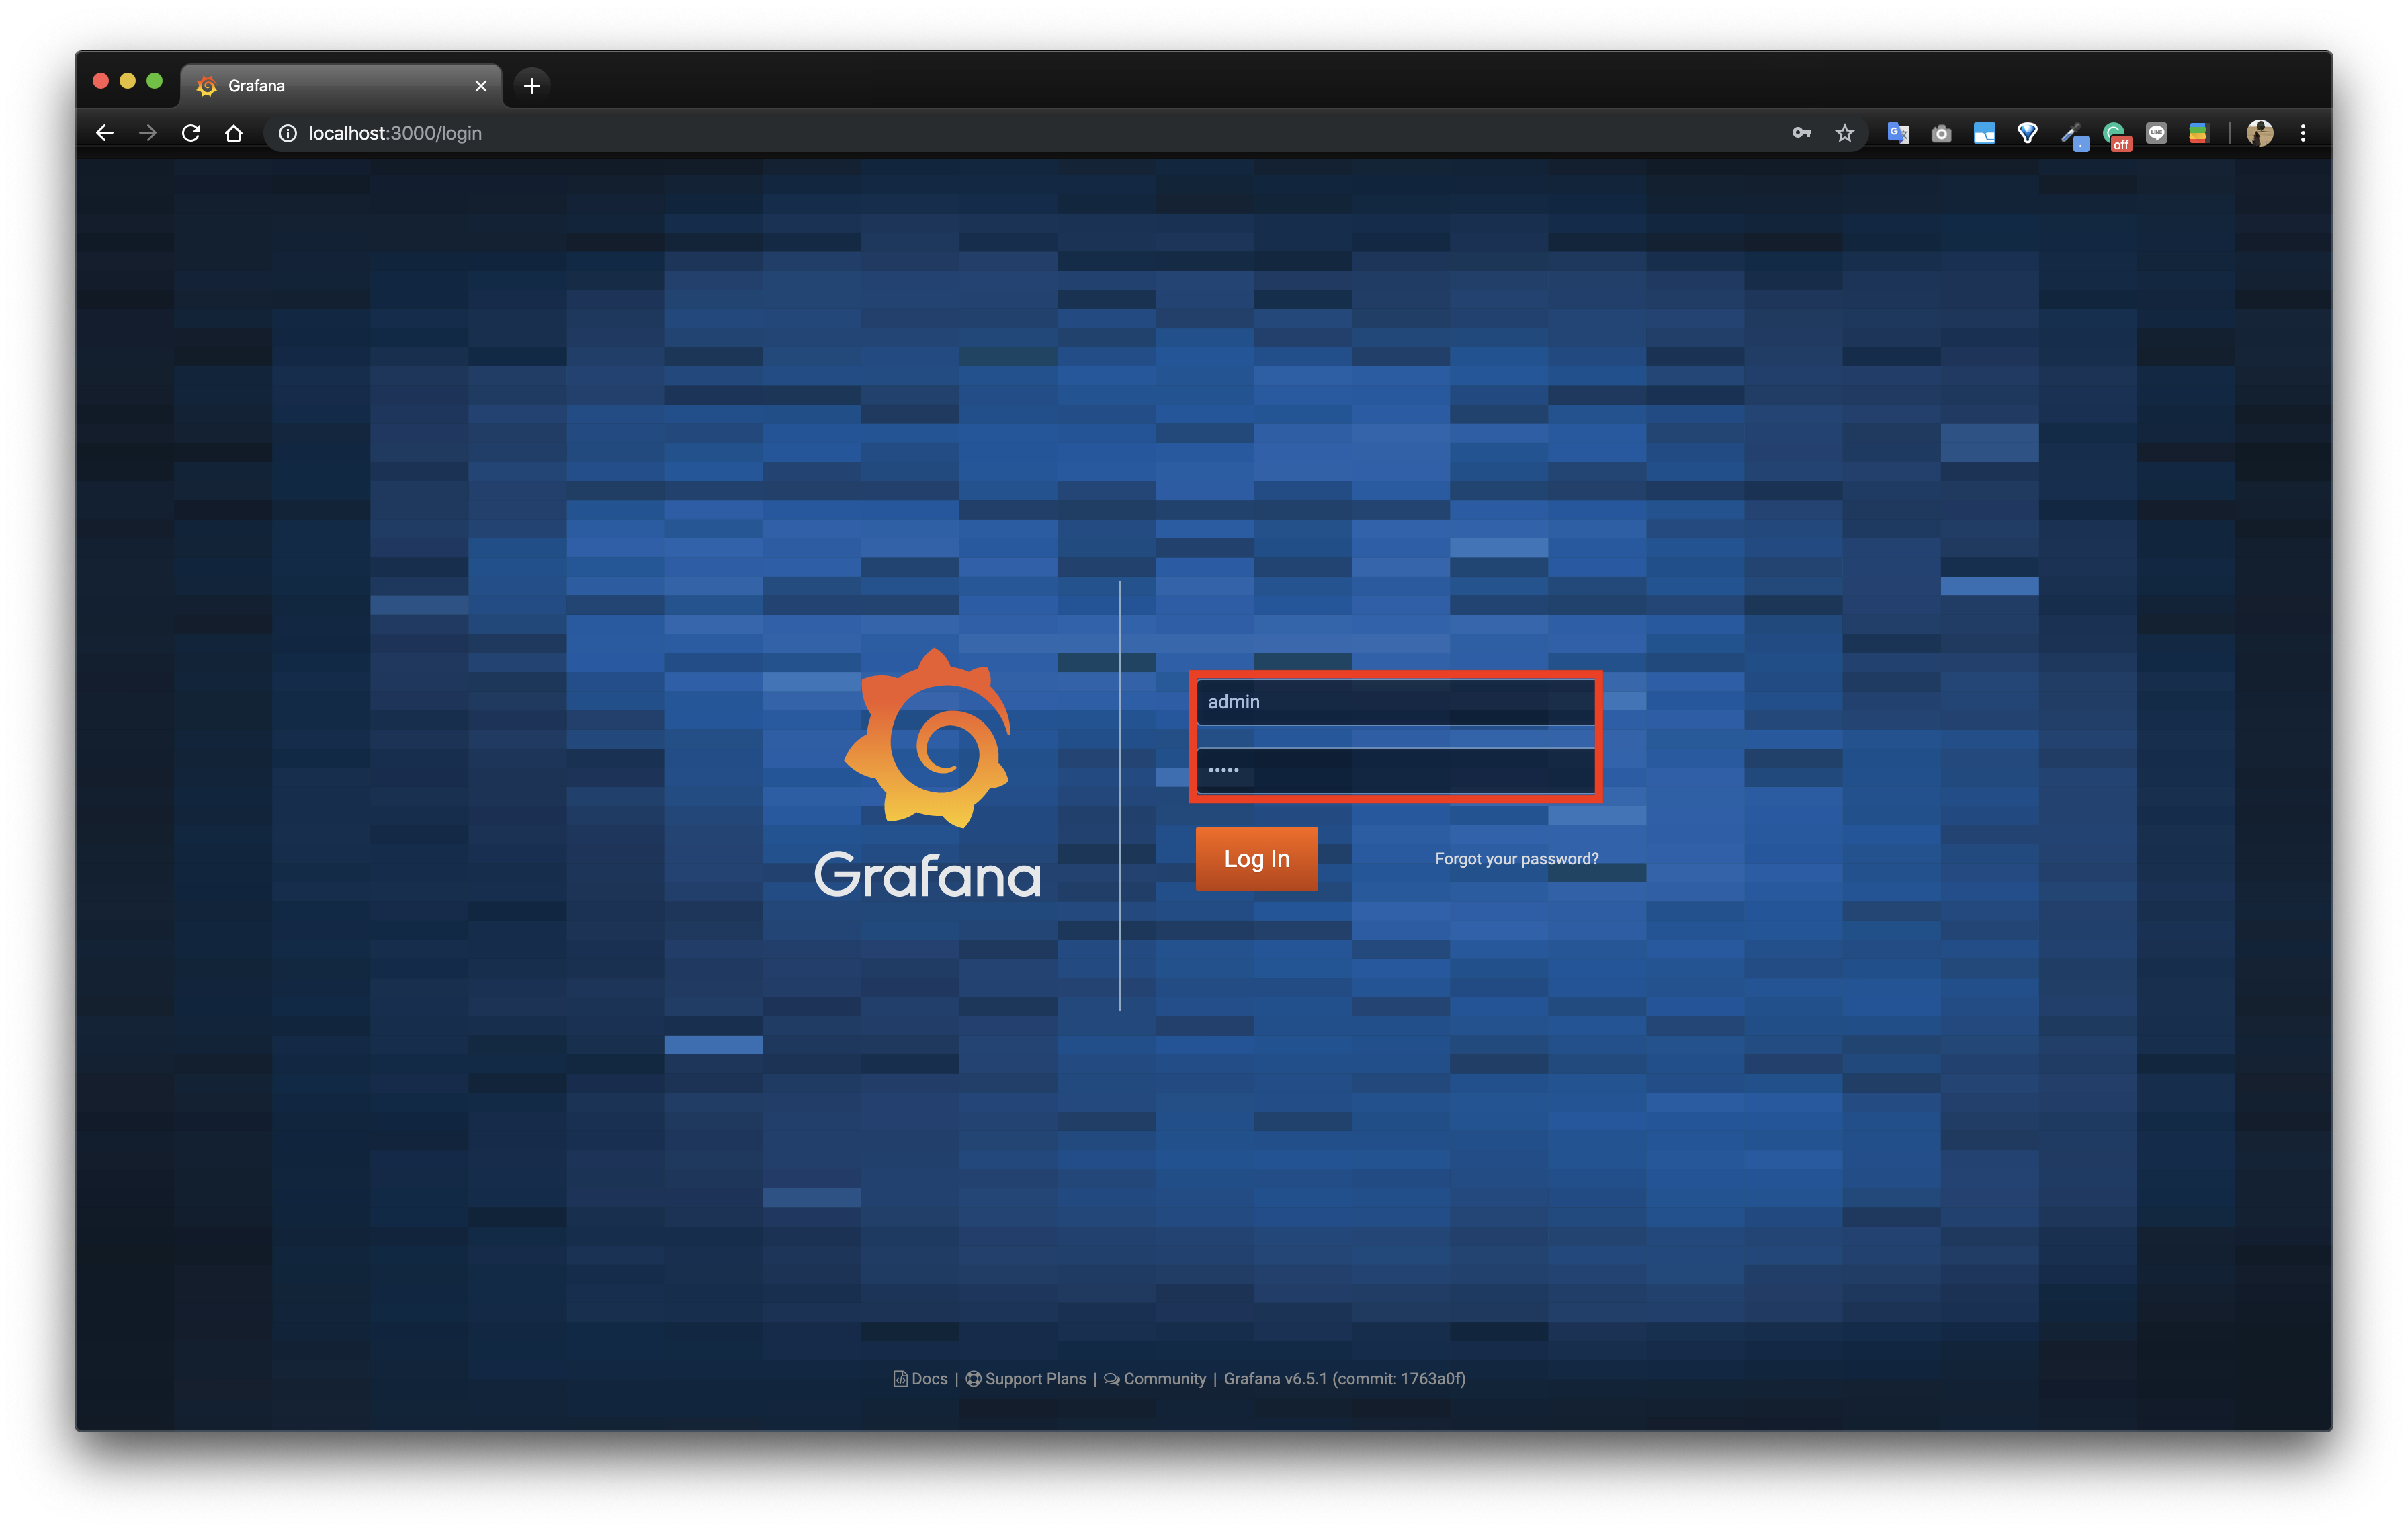
Home Dashboard에서 Add data source를 클릭해 Data Source 추가하자.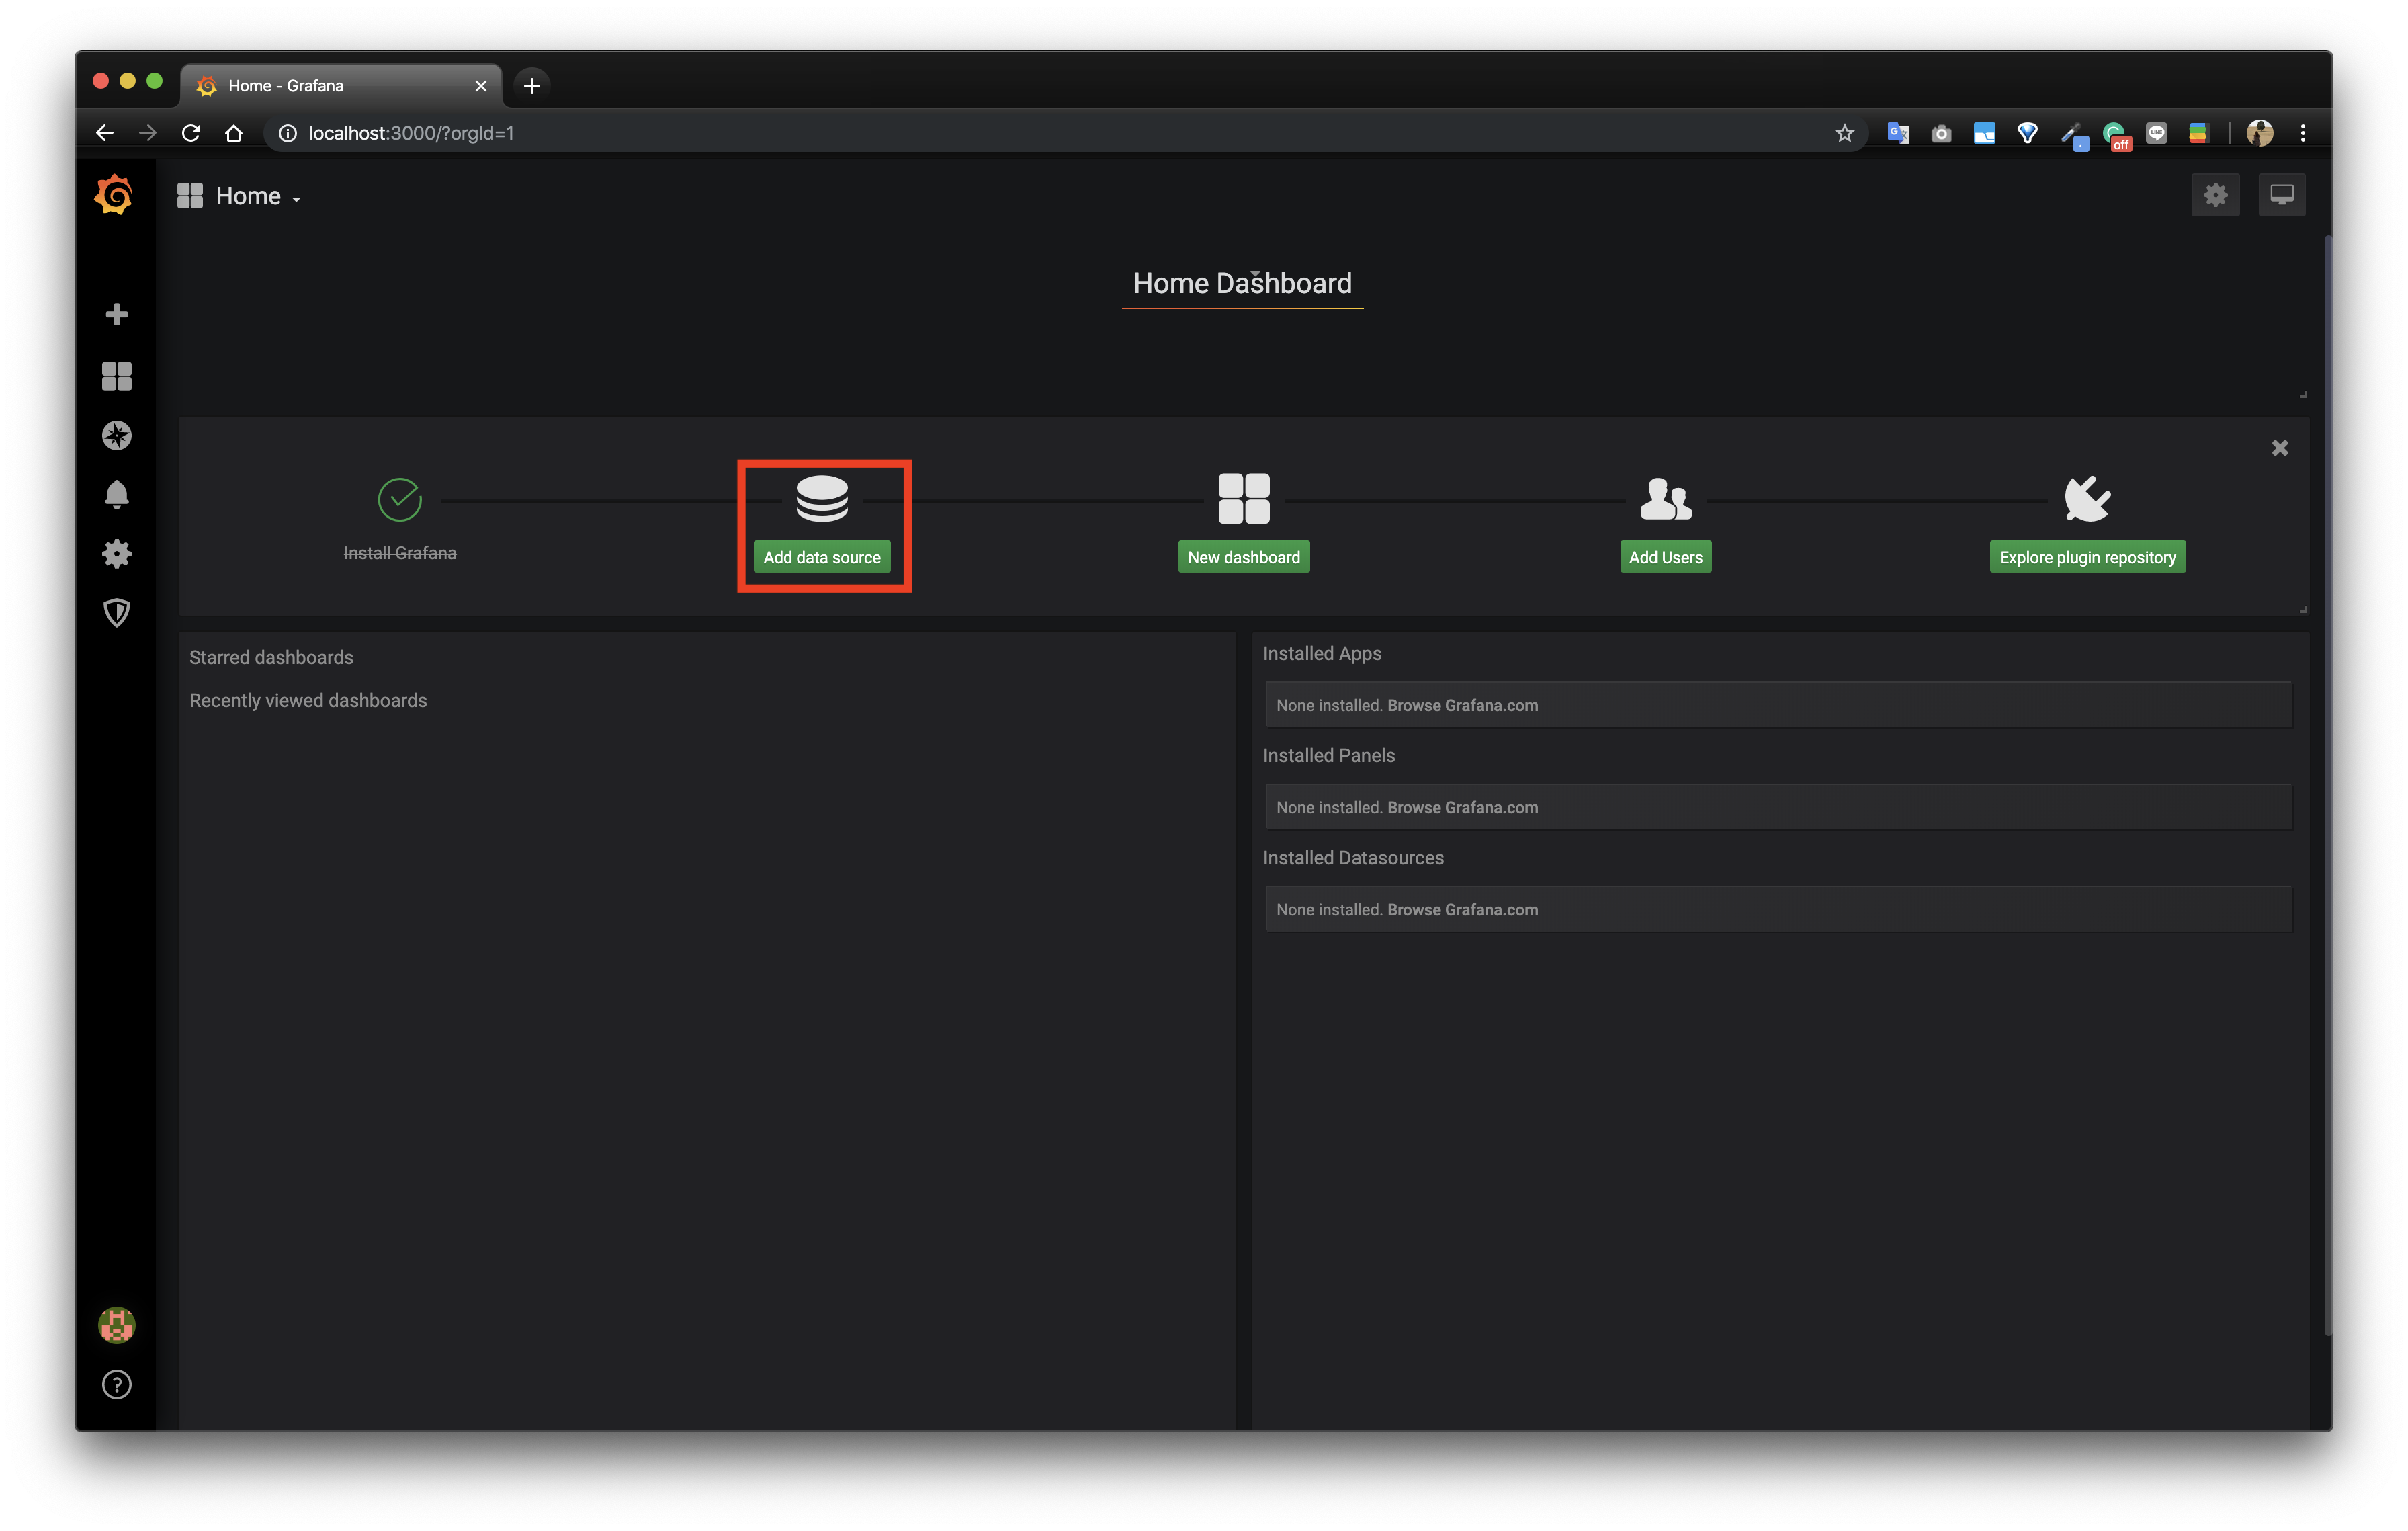
Grafana에서 시각화할 데이터로서 Prometheus에 수집되고 있는 metric을 사용할 것이기 때문에 Prometheus를 선택한다.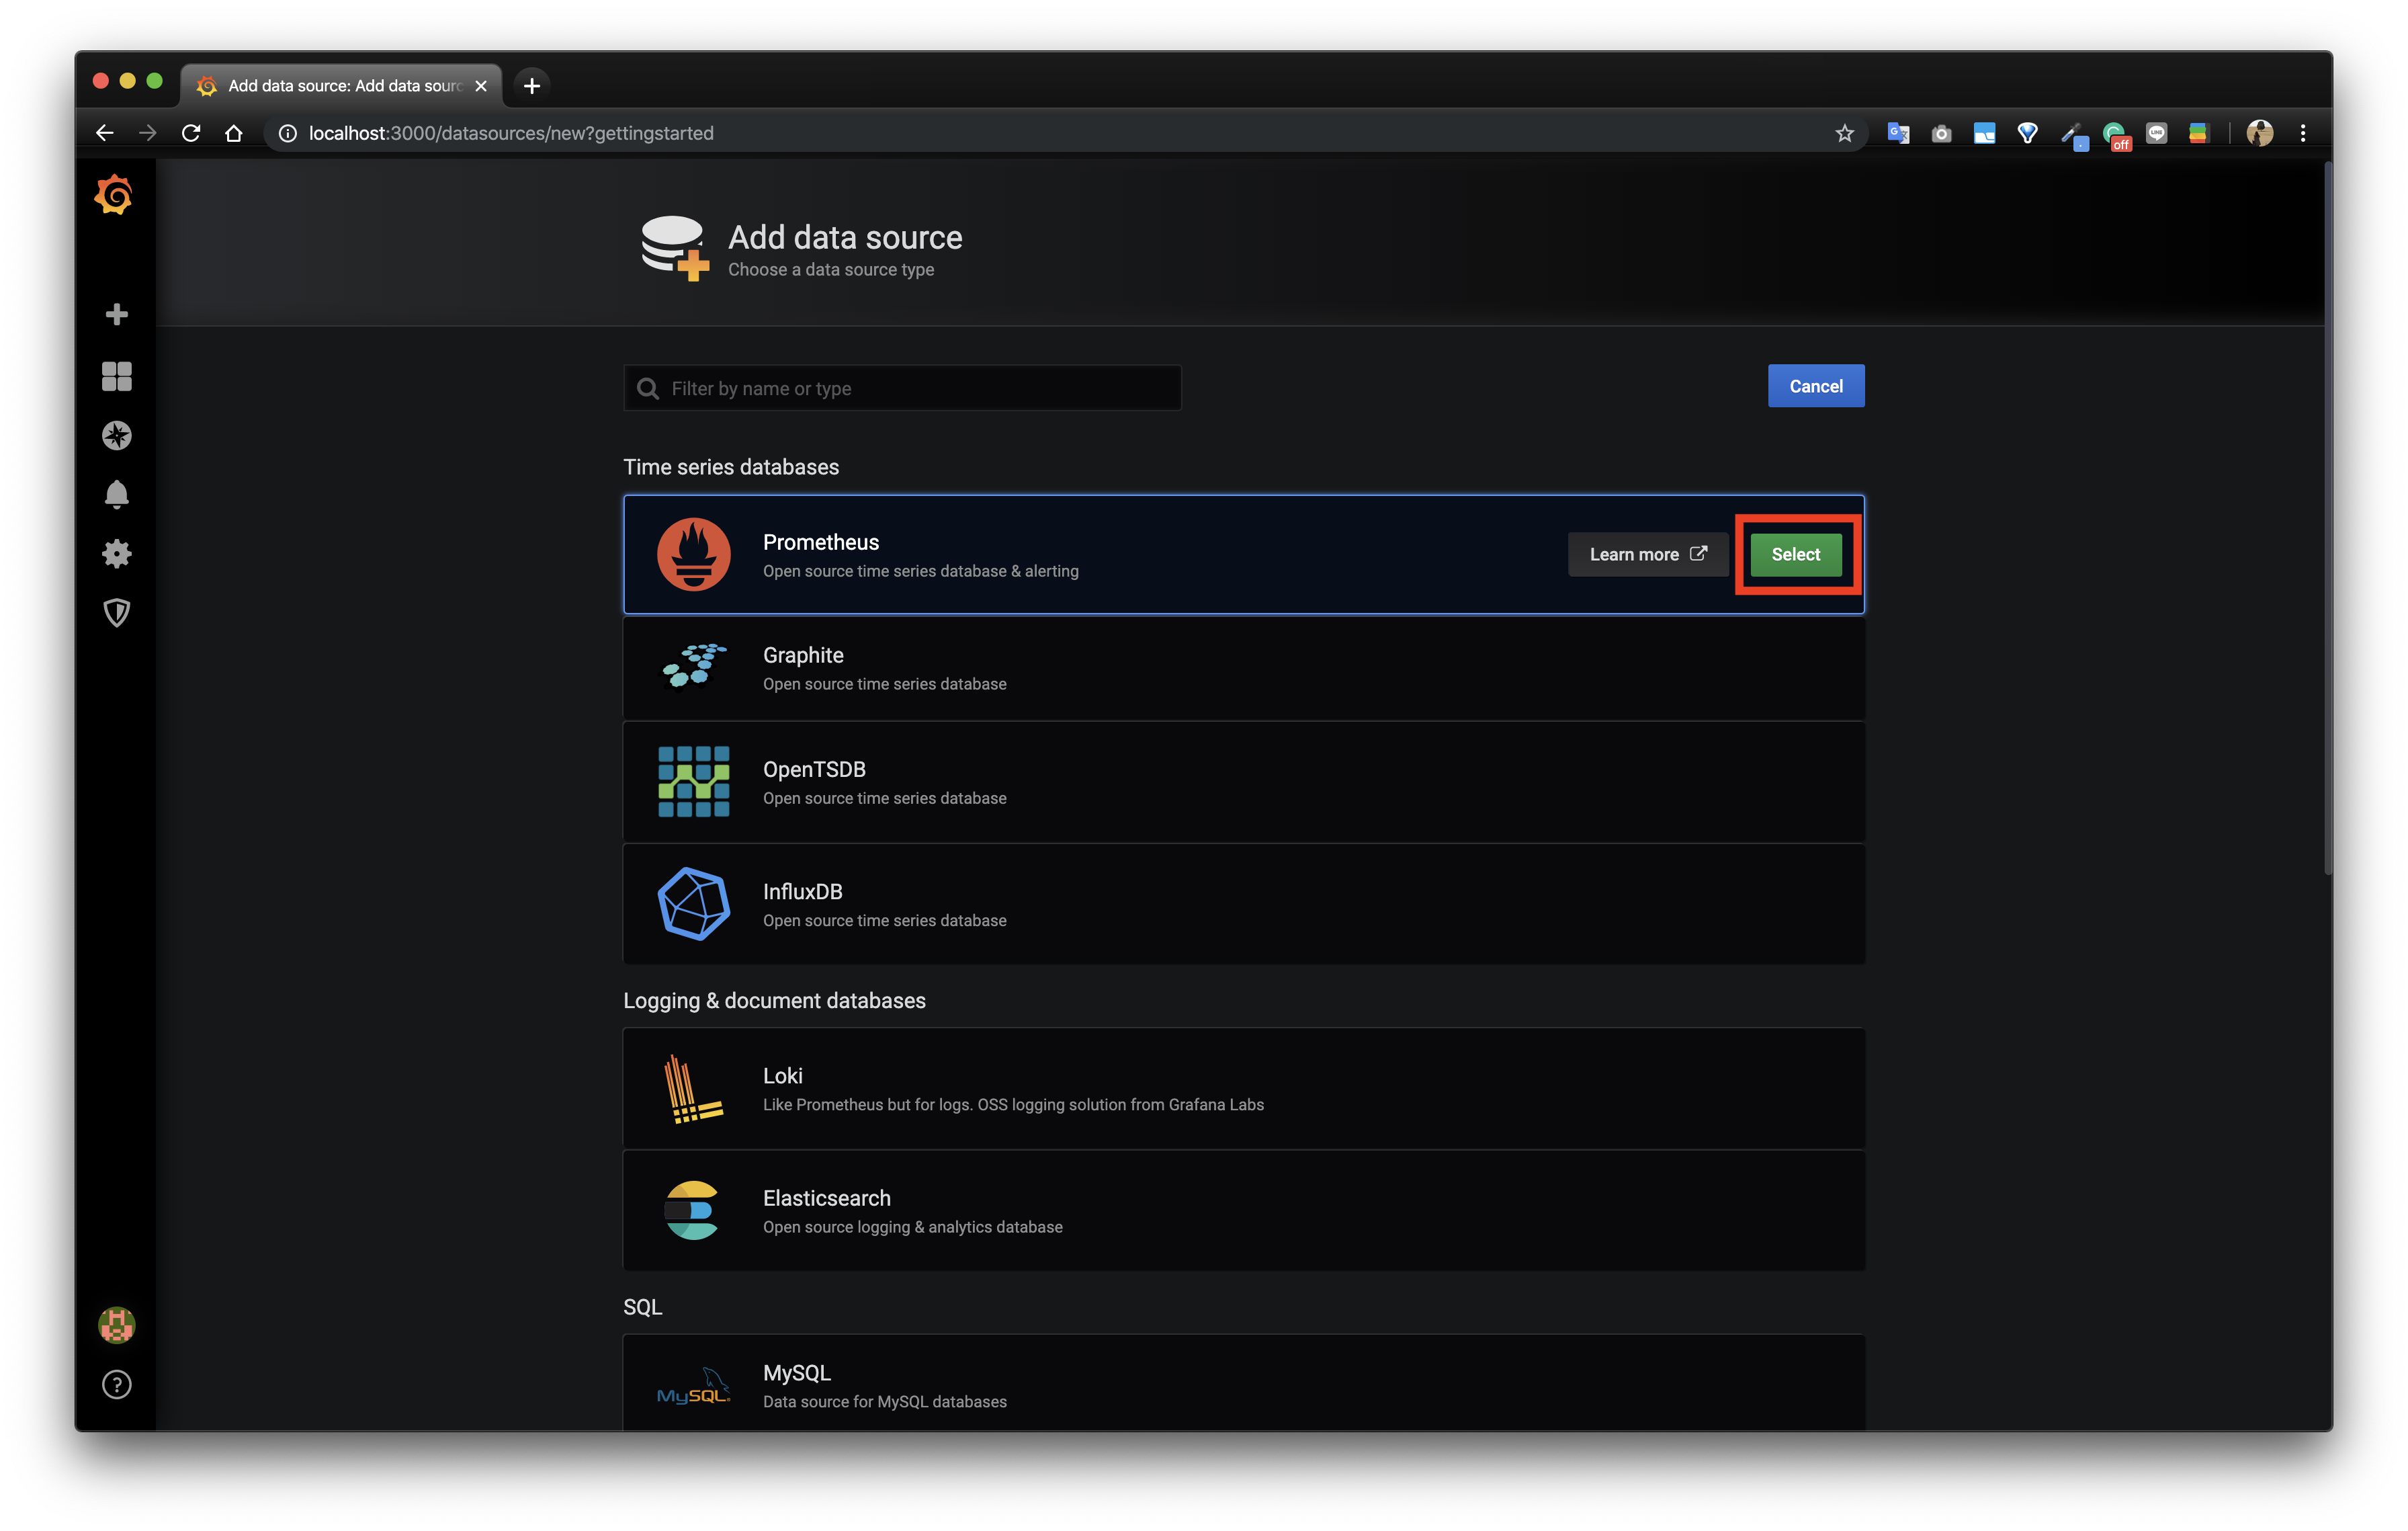
Name과 URL(Prometheus Server)을 설정하고 Save & Test를 클릭한다.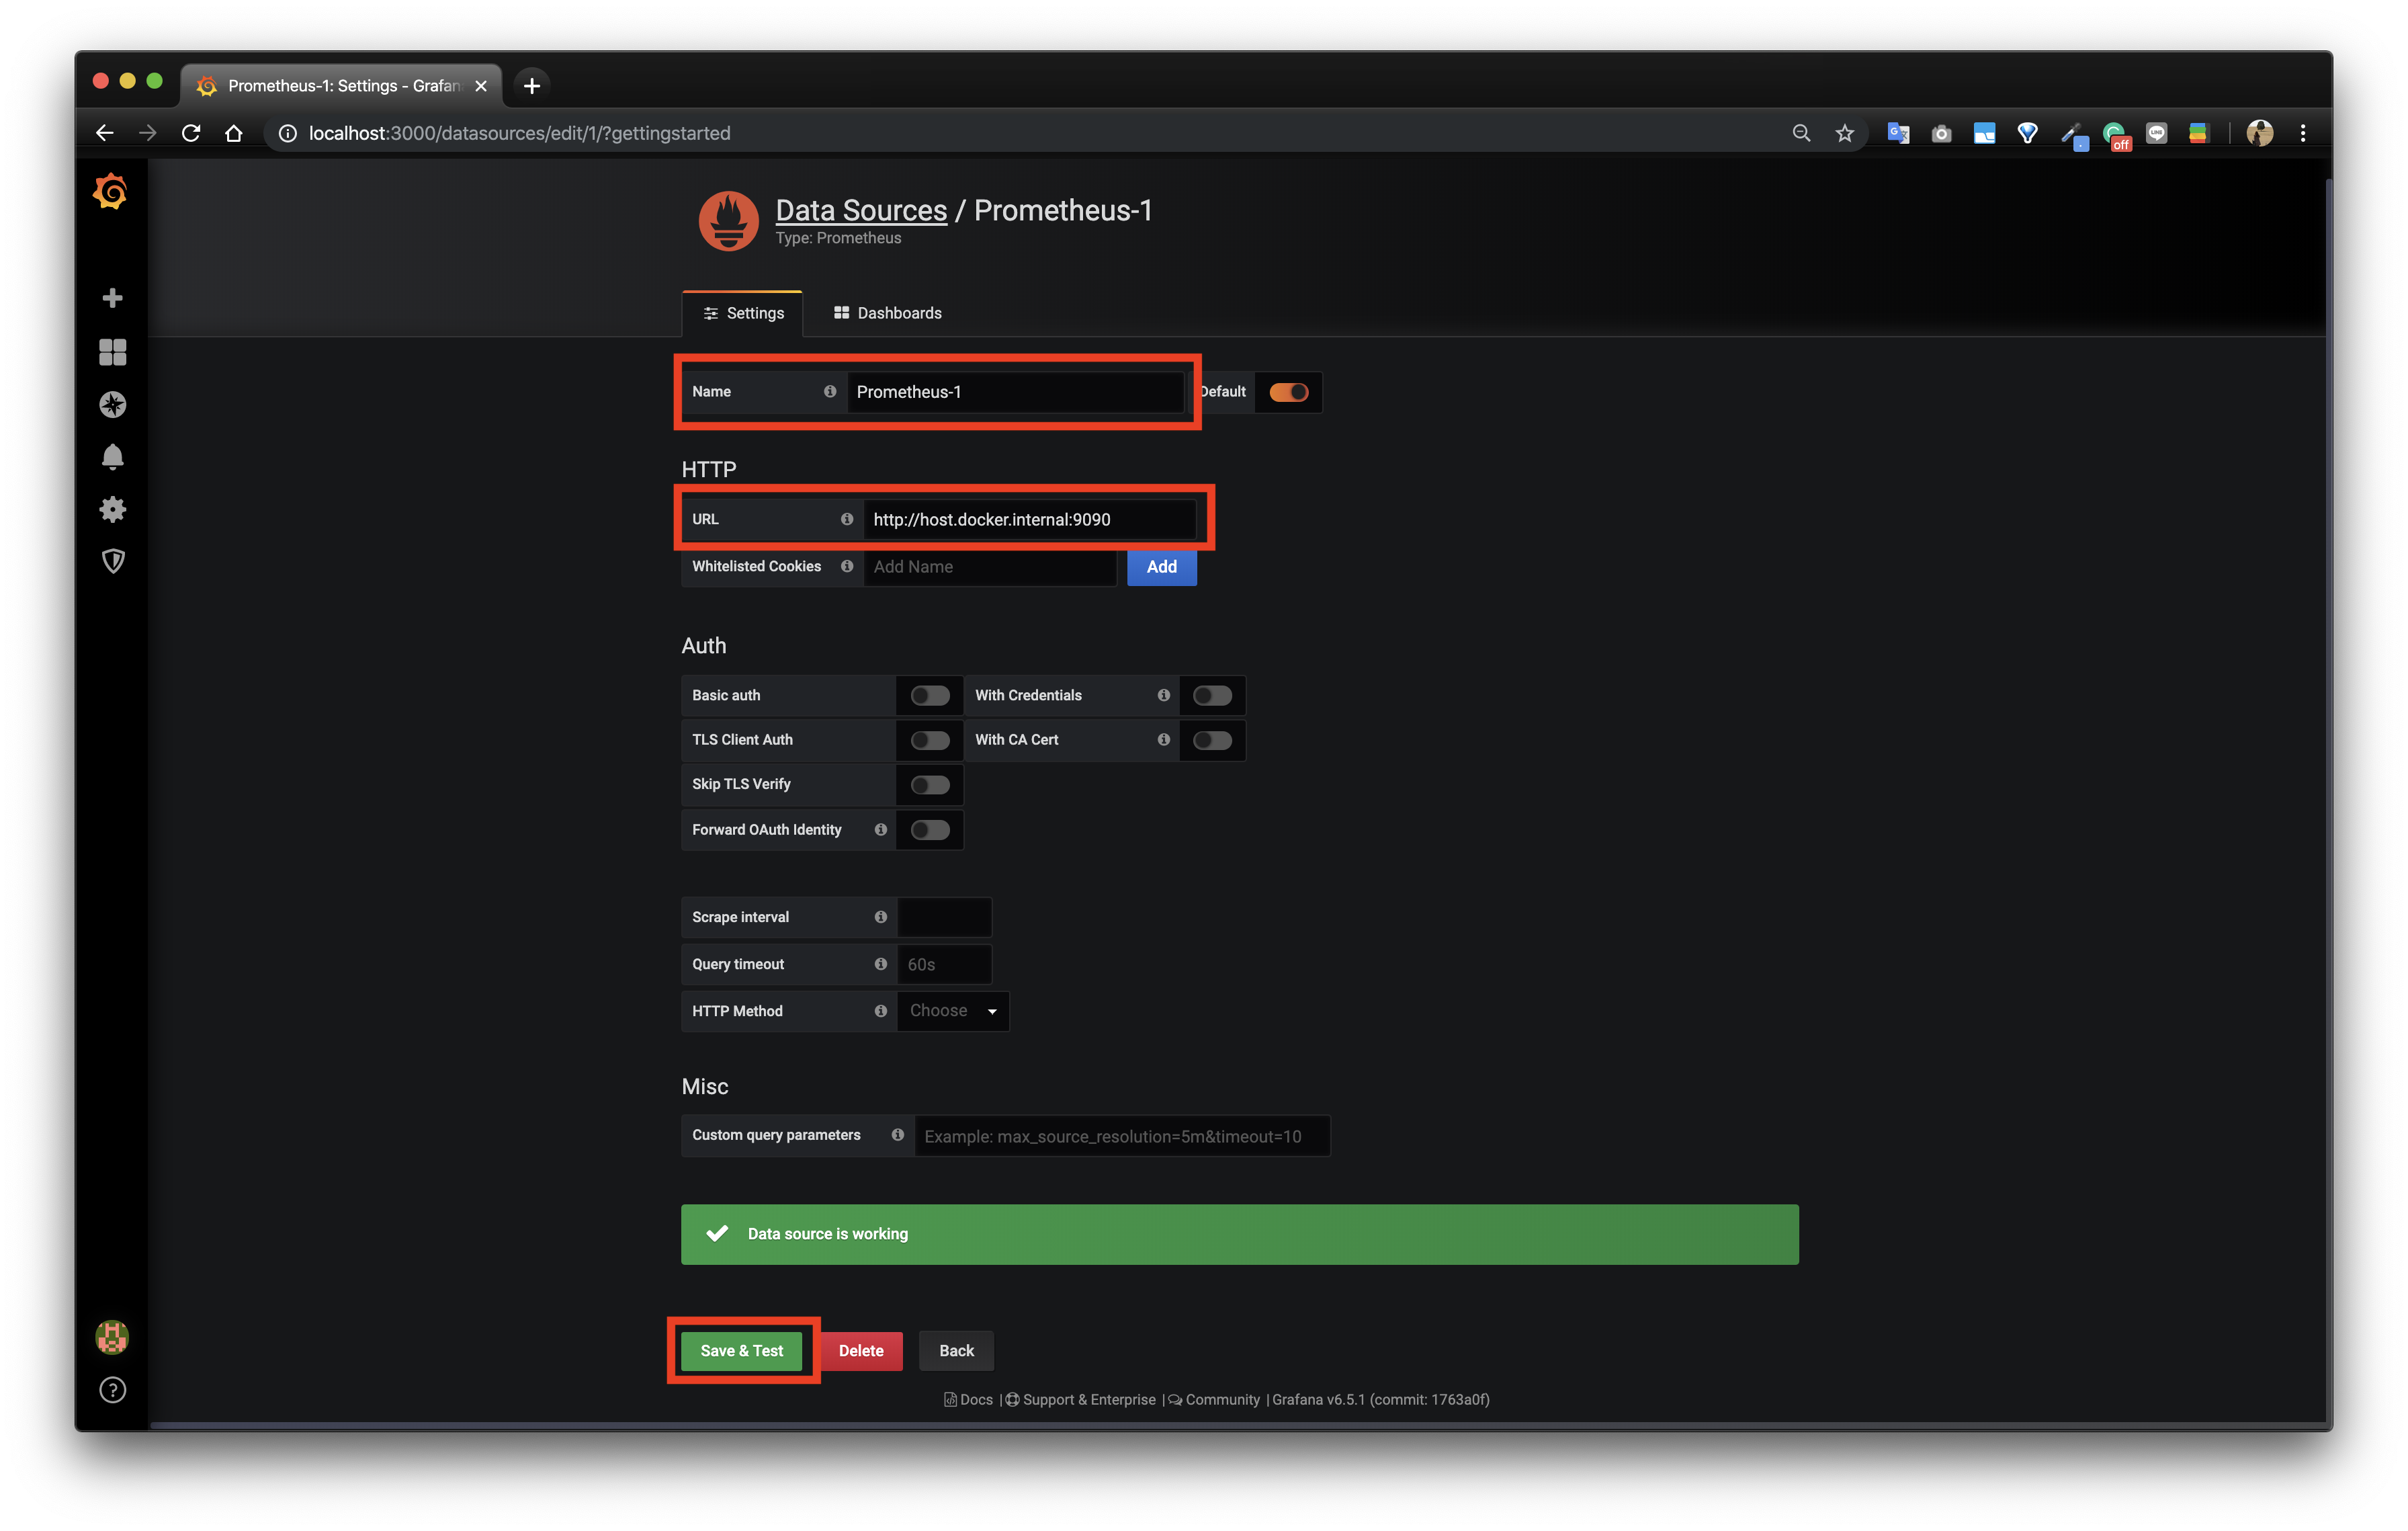
Prometheus가 Data Source로 추가되었다.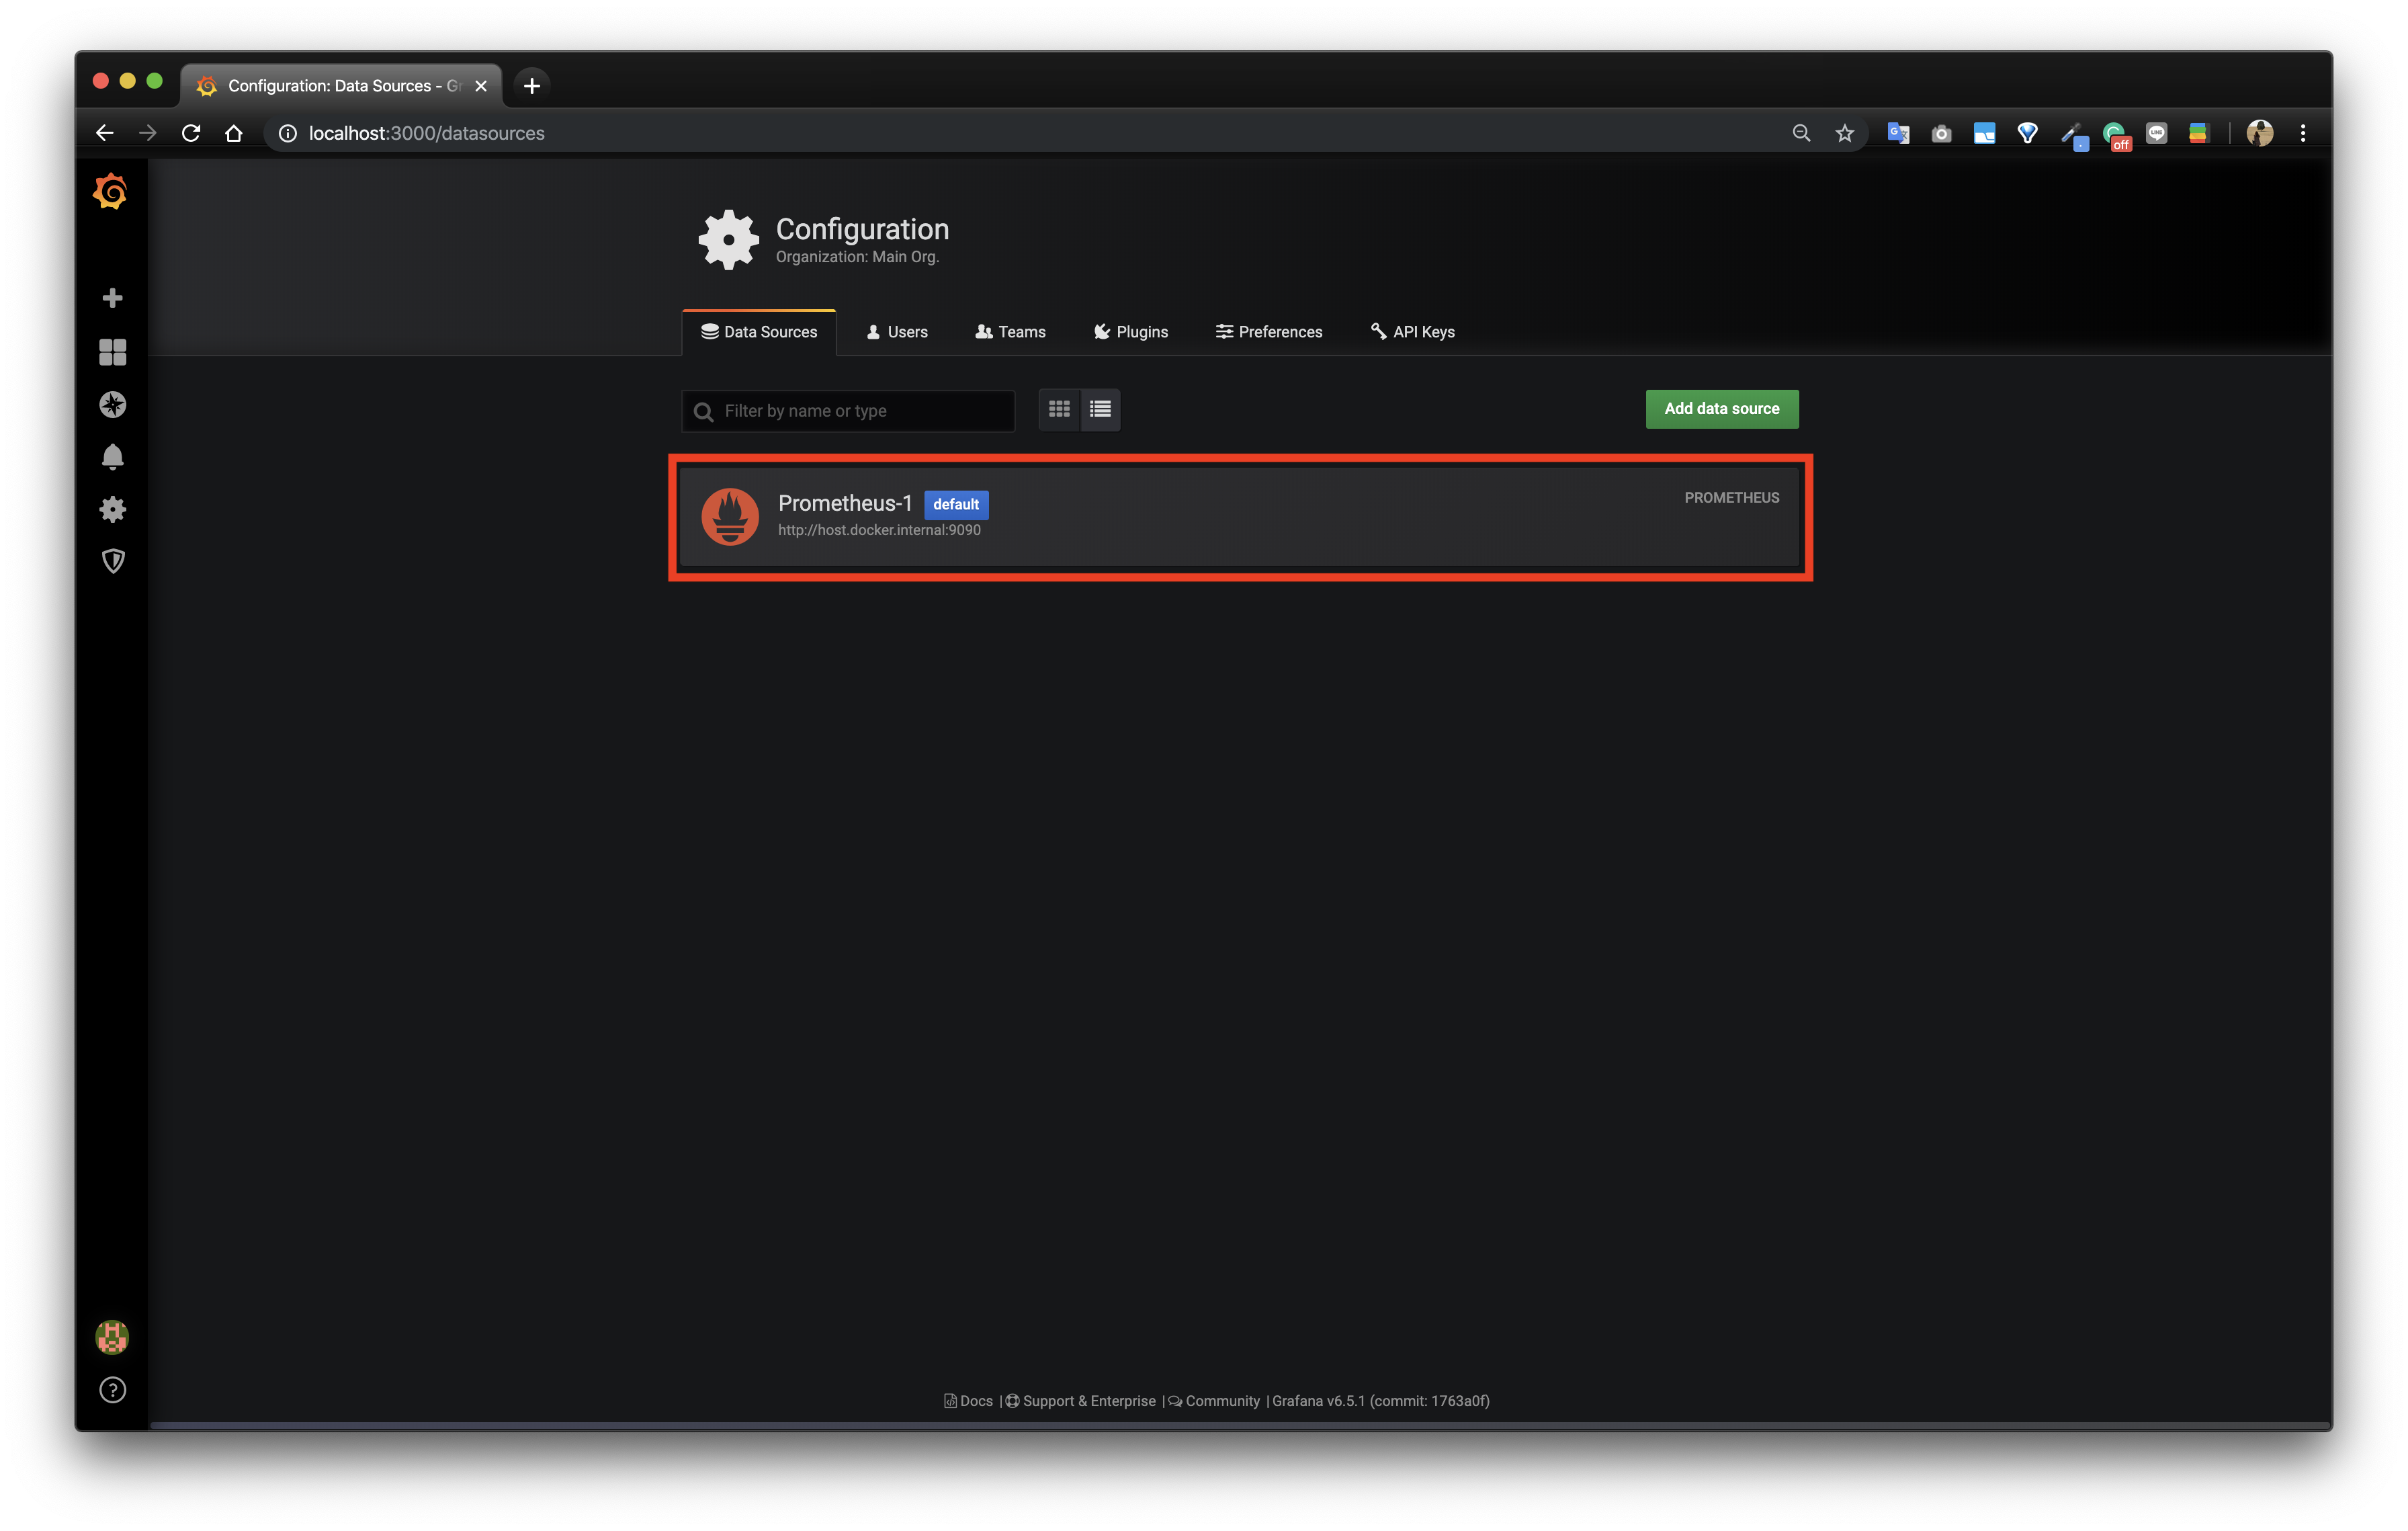
다음으로는 Data Source를 이용해 Dashboard를 생성해보자.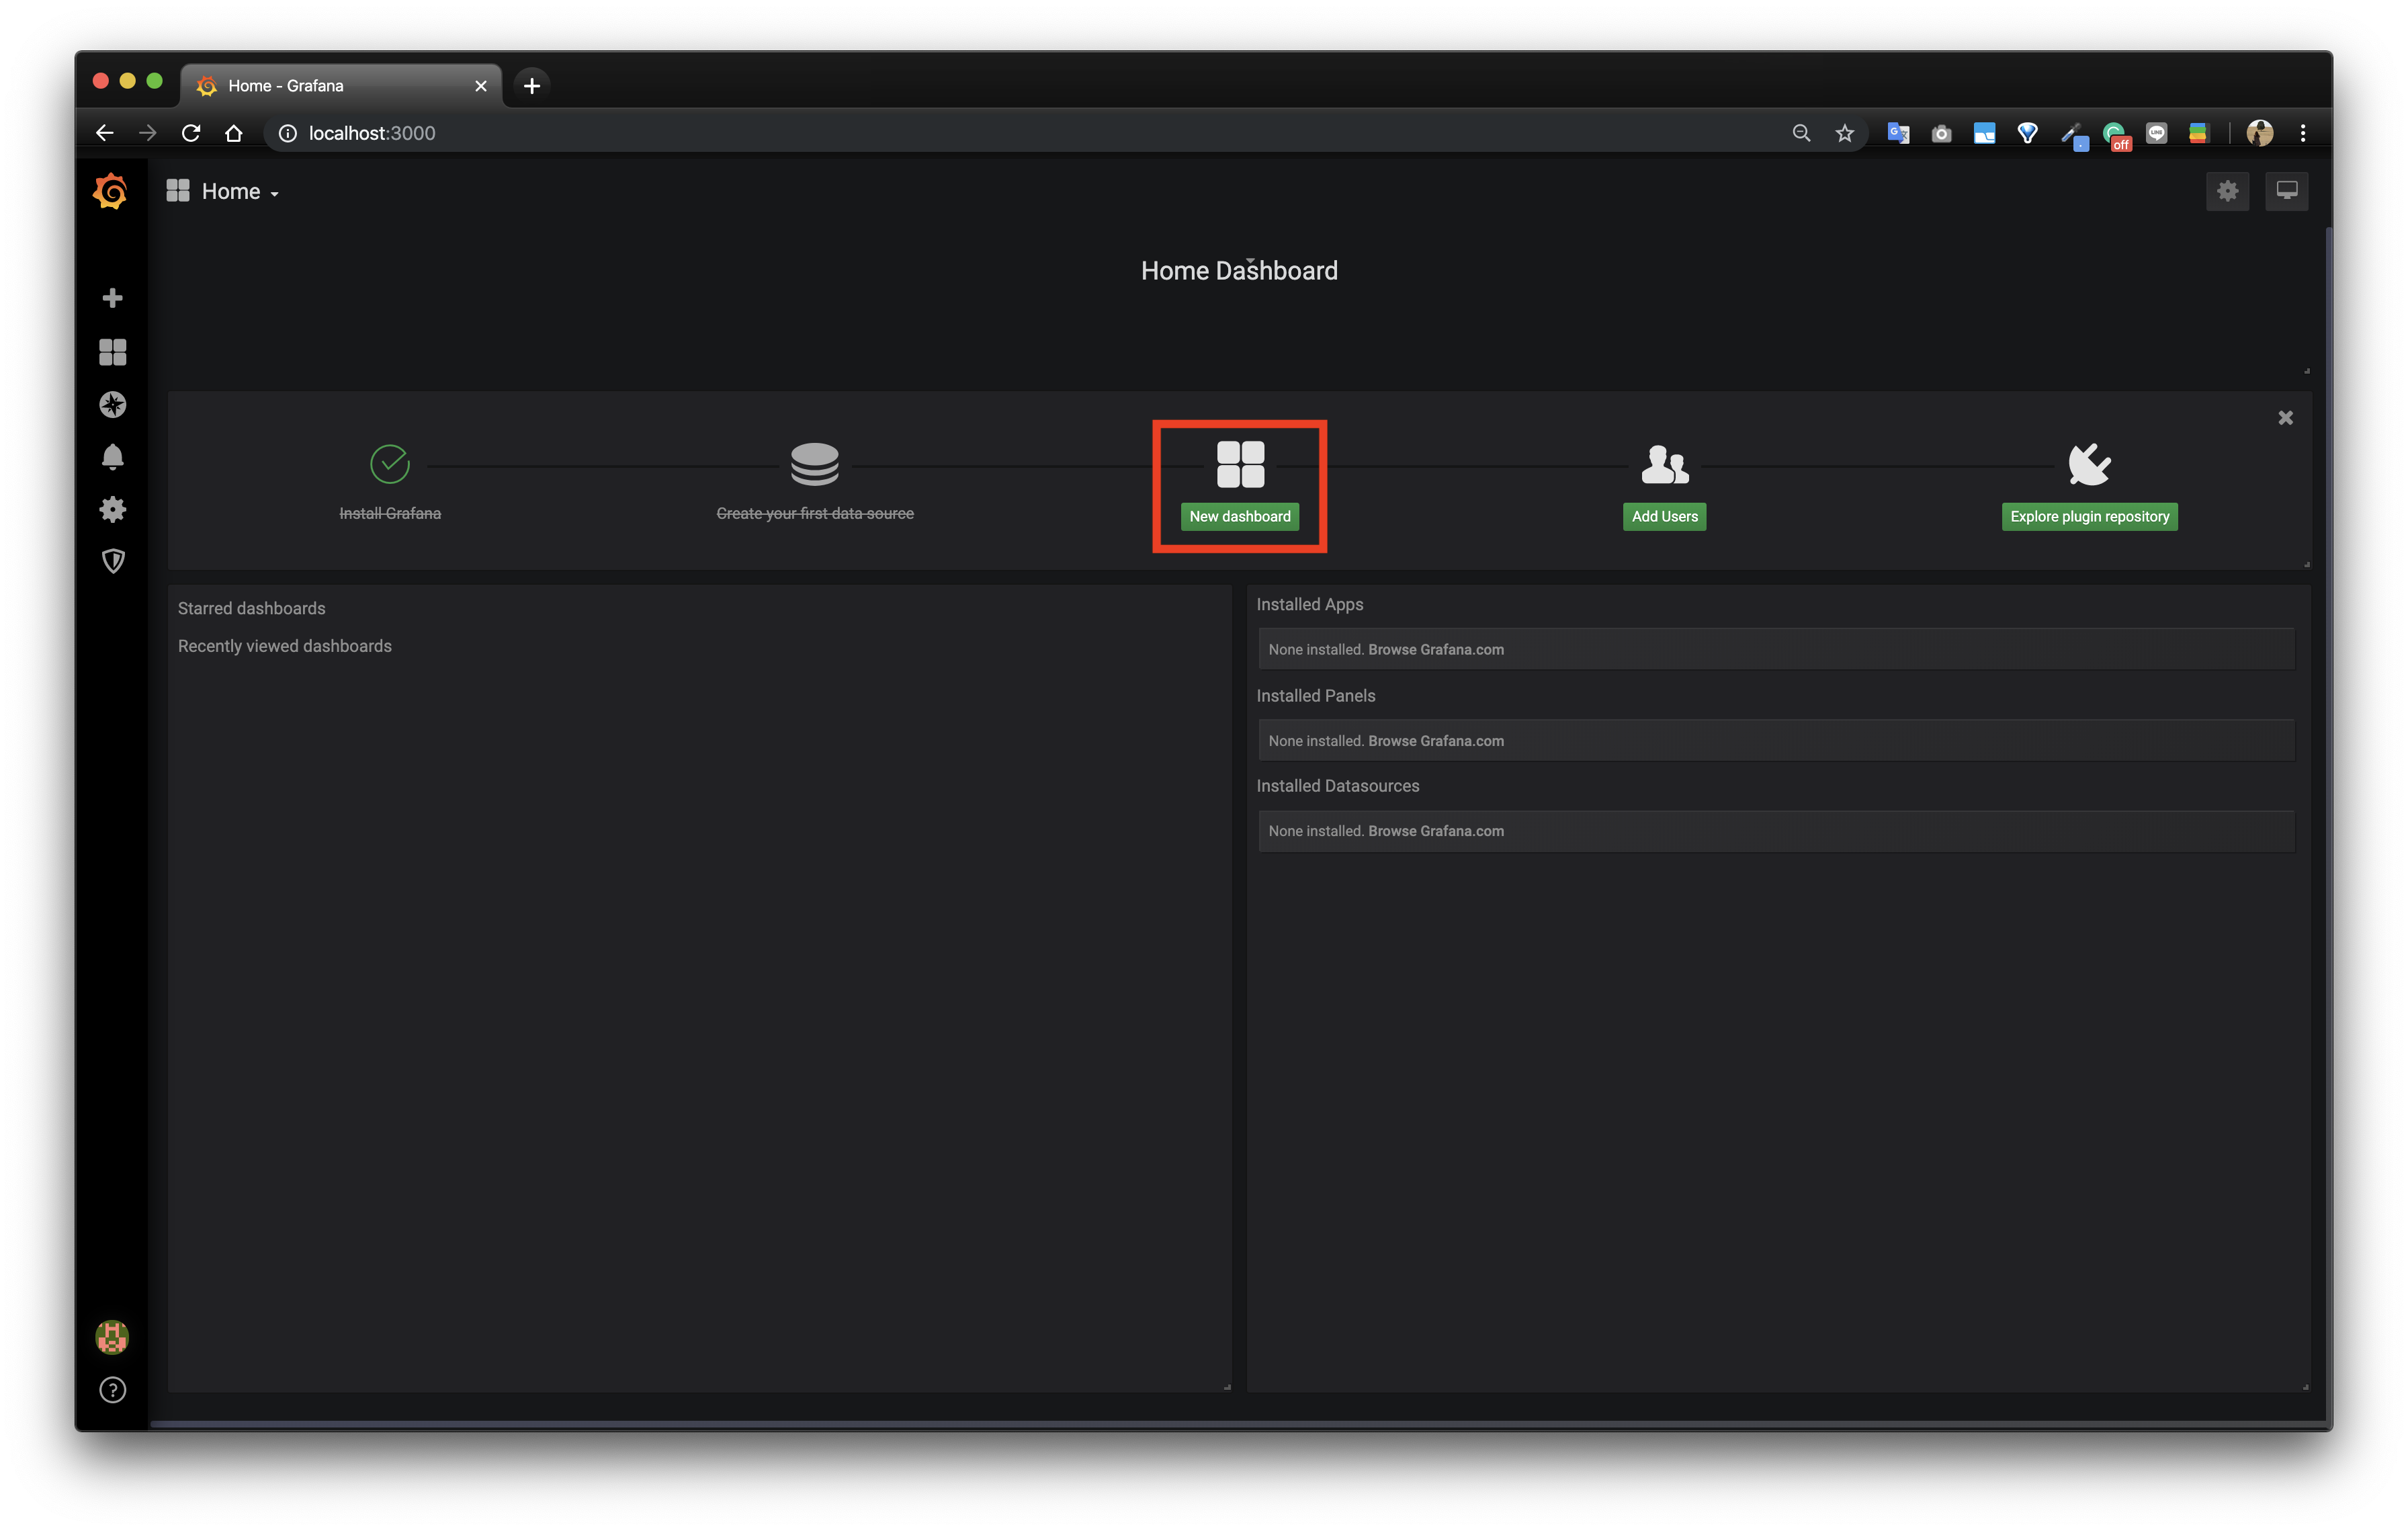
그래프를 이용해볼 것이기 때문에 Choose Visualization을 클릭한다.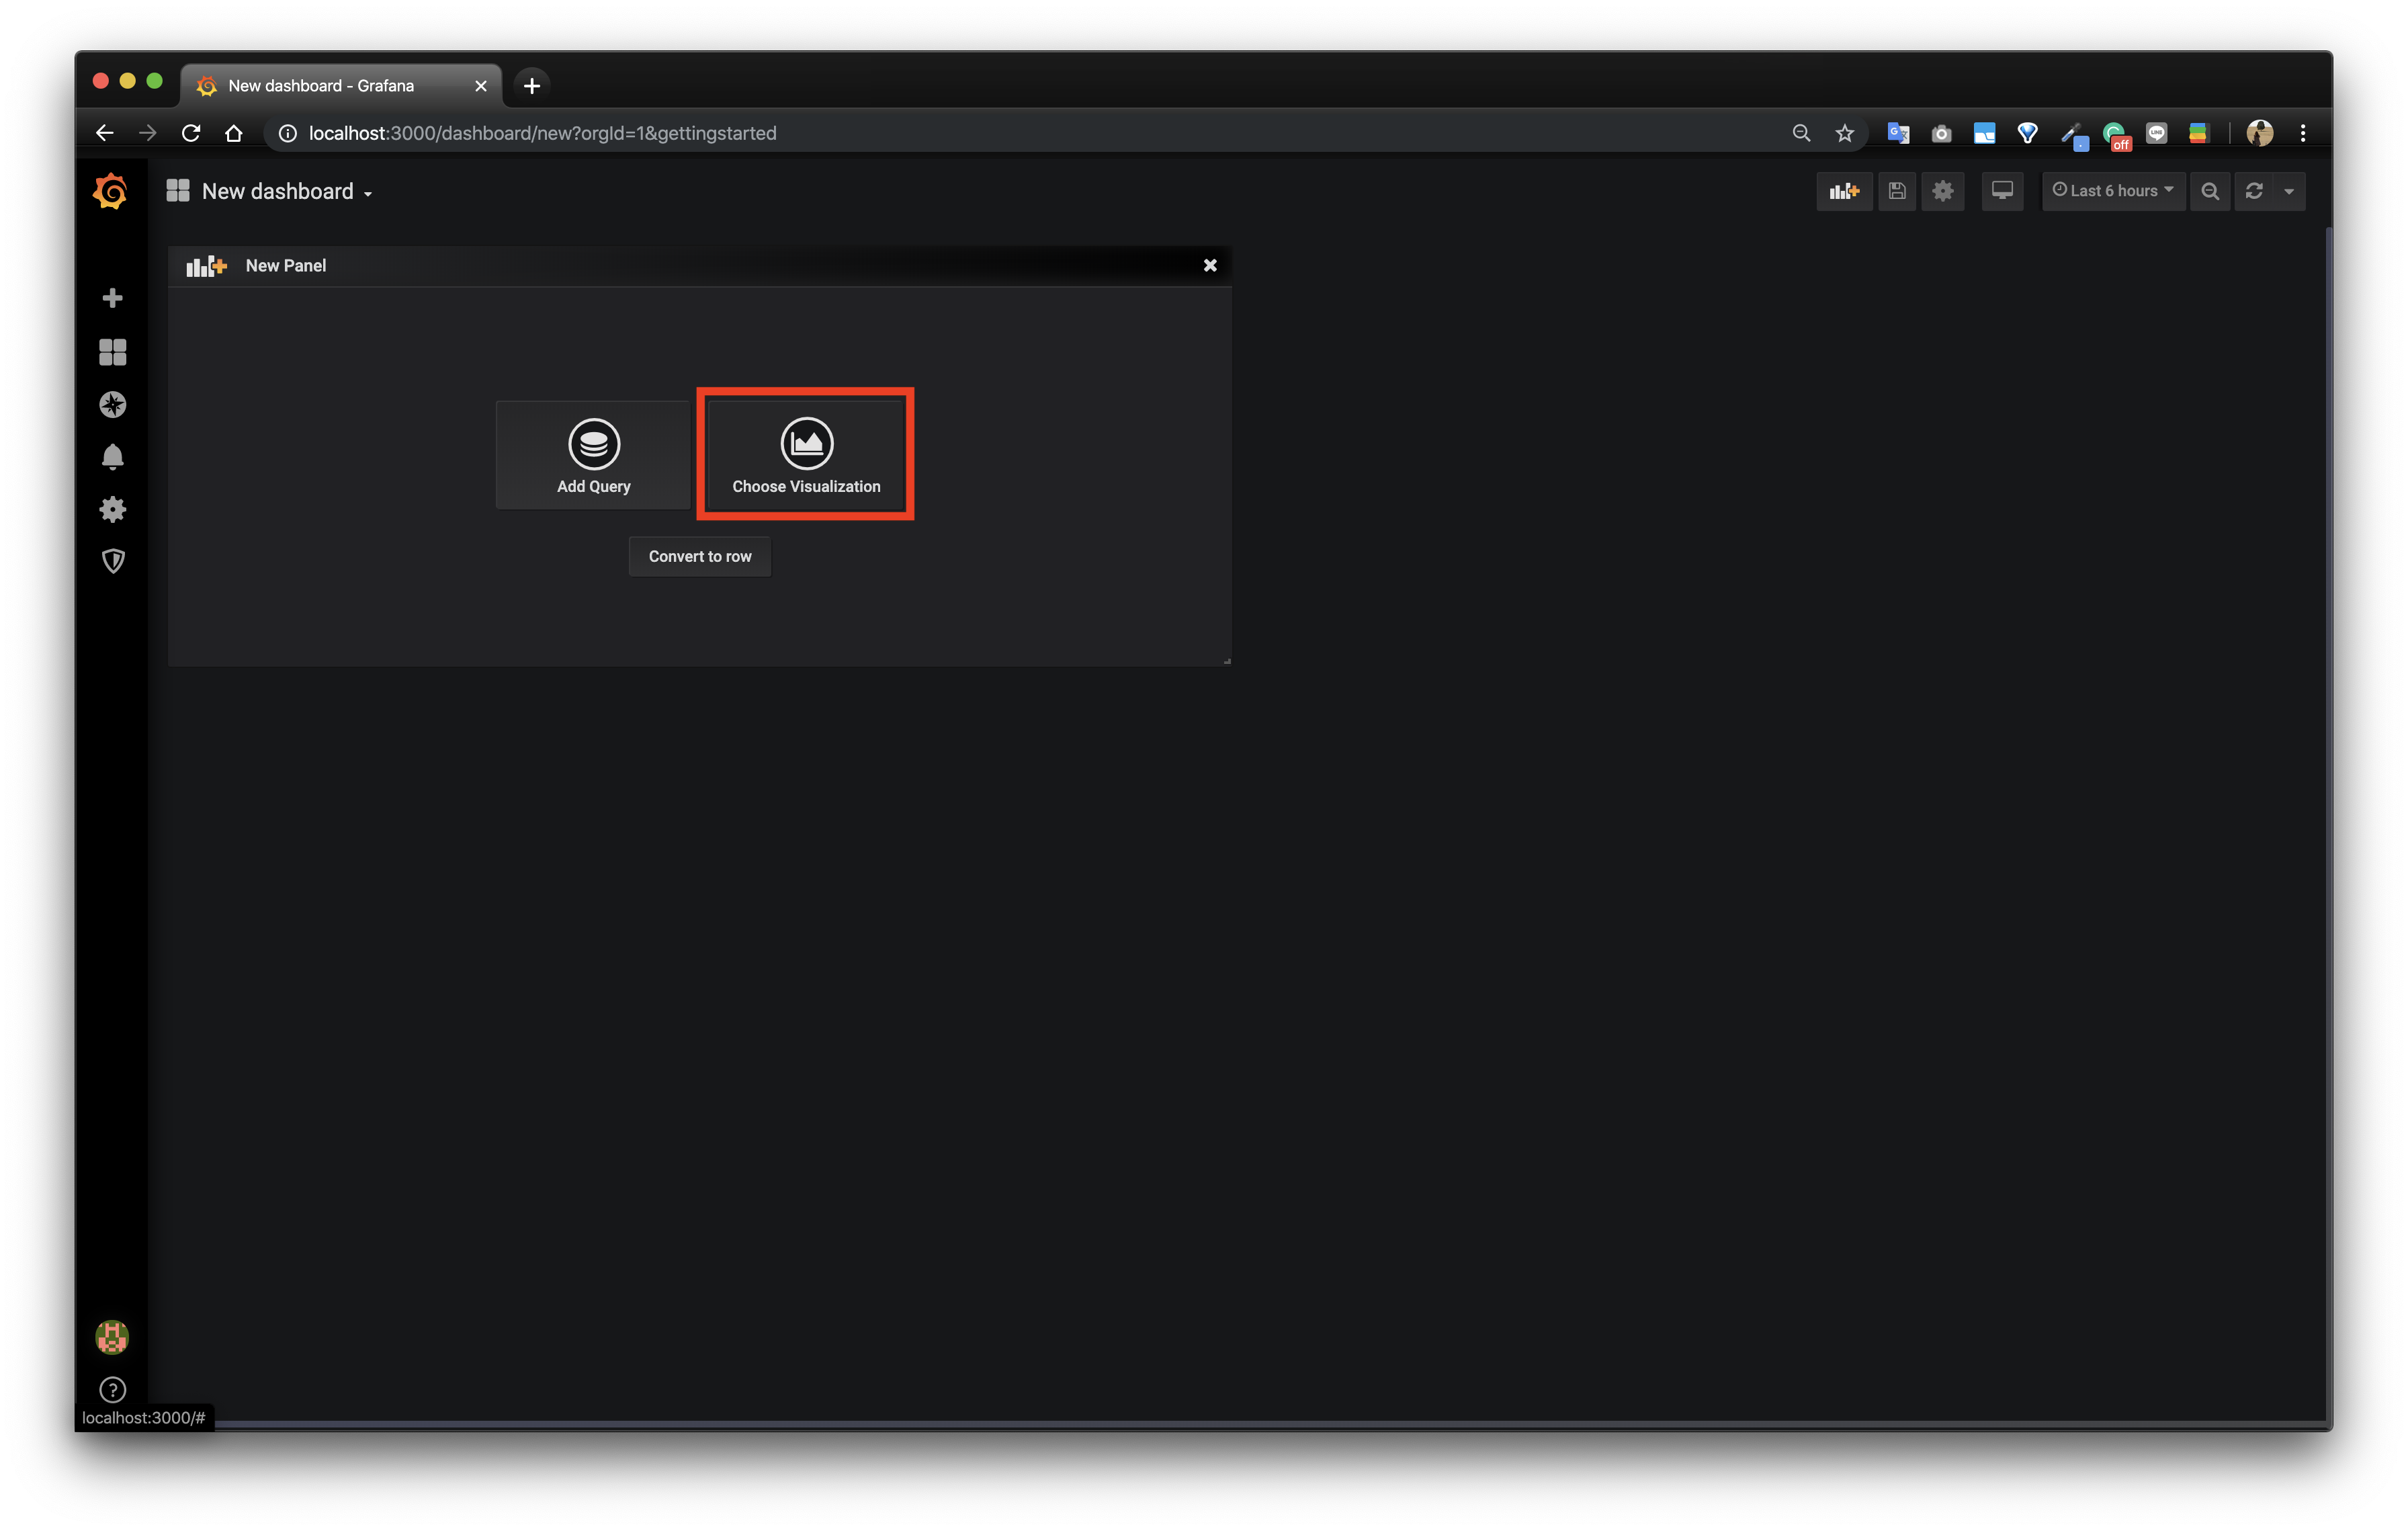
Metrics로 이전에 Prometheus에서도 확인해보았던 jvm_memoruy_used_bytes를 선택한다.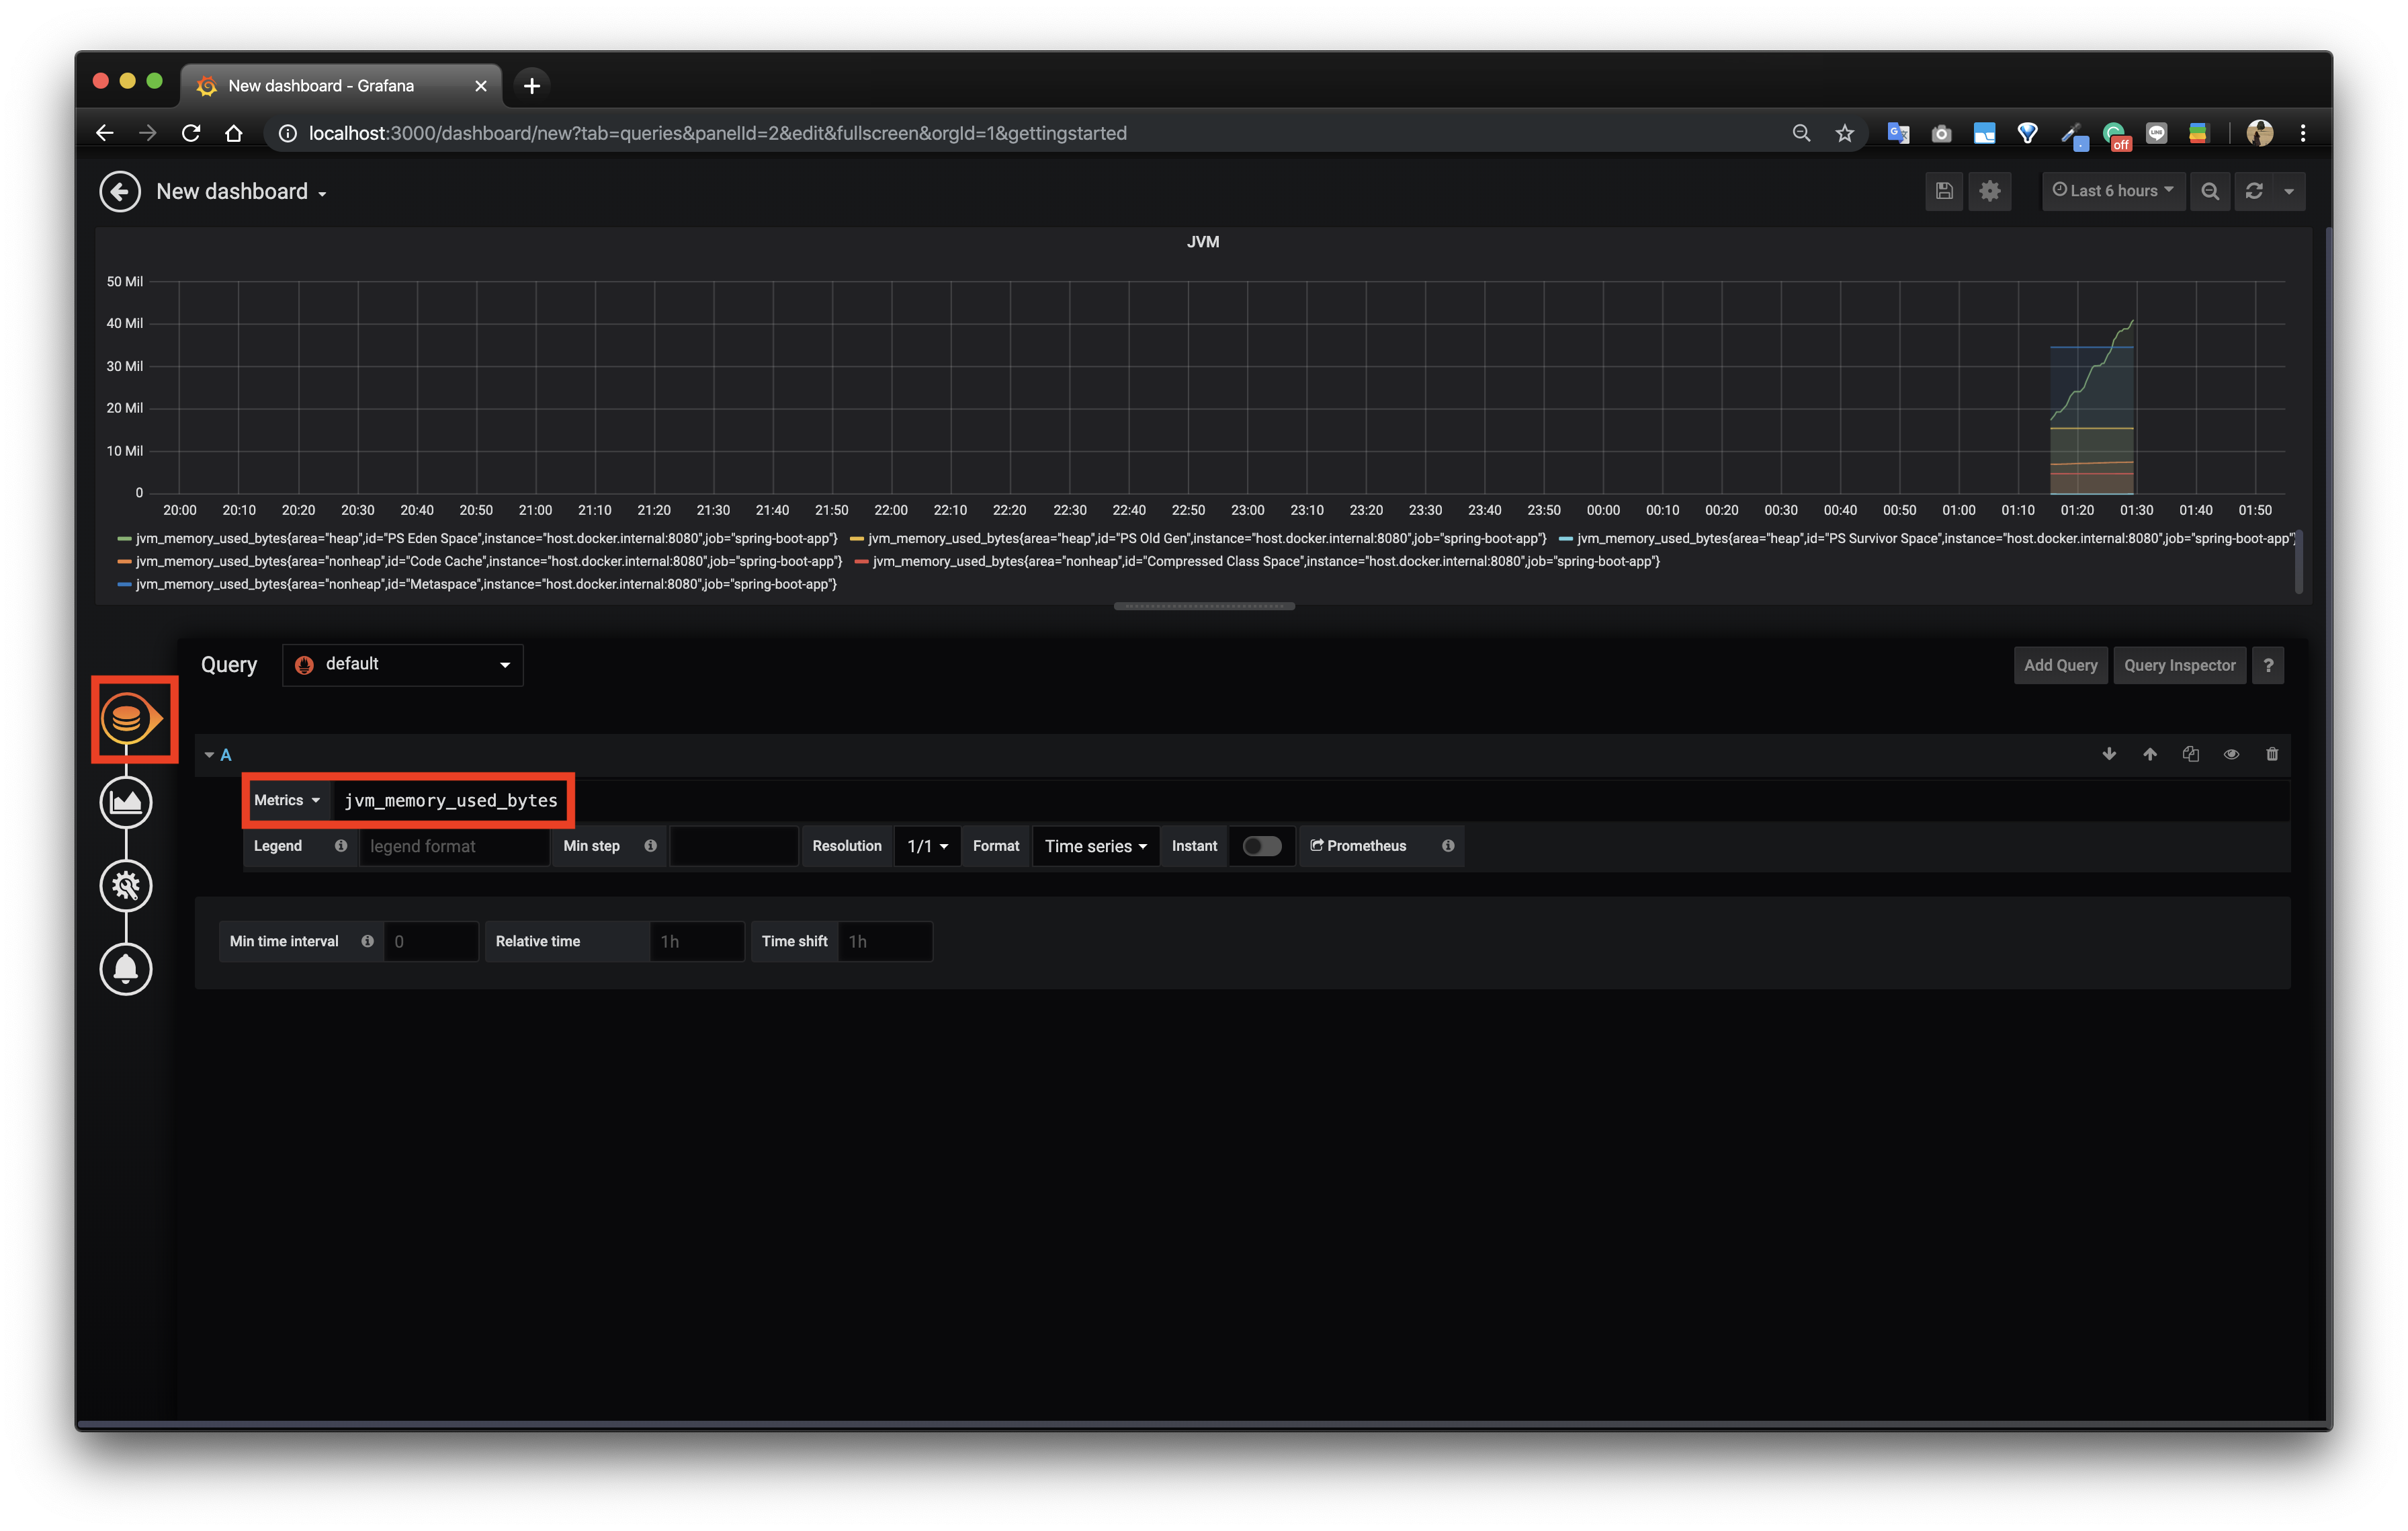
작업한 Dashboard를 저장한다.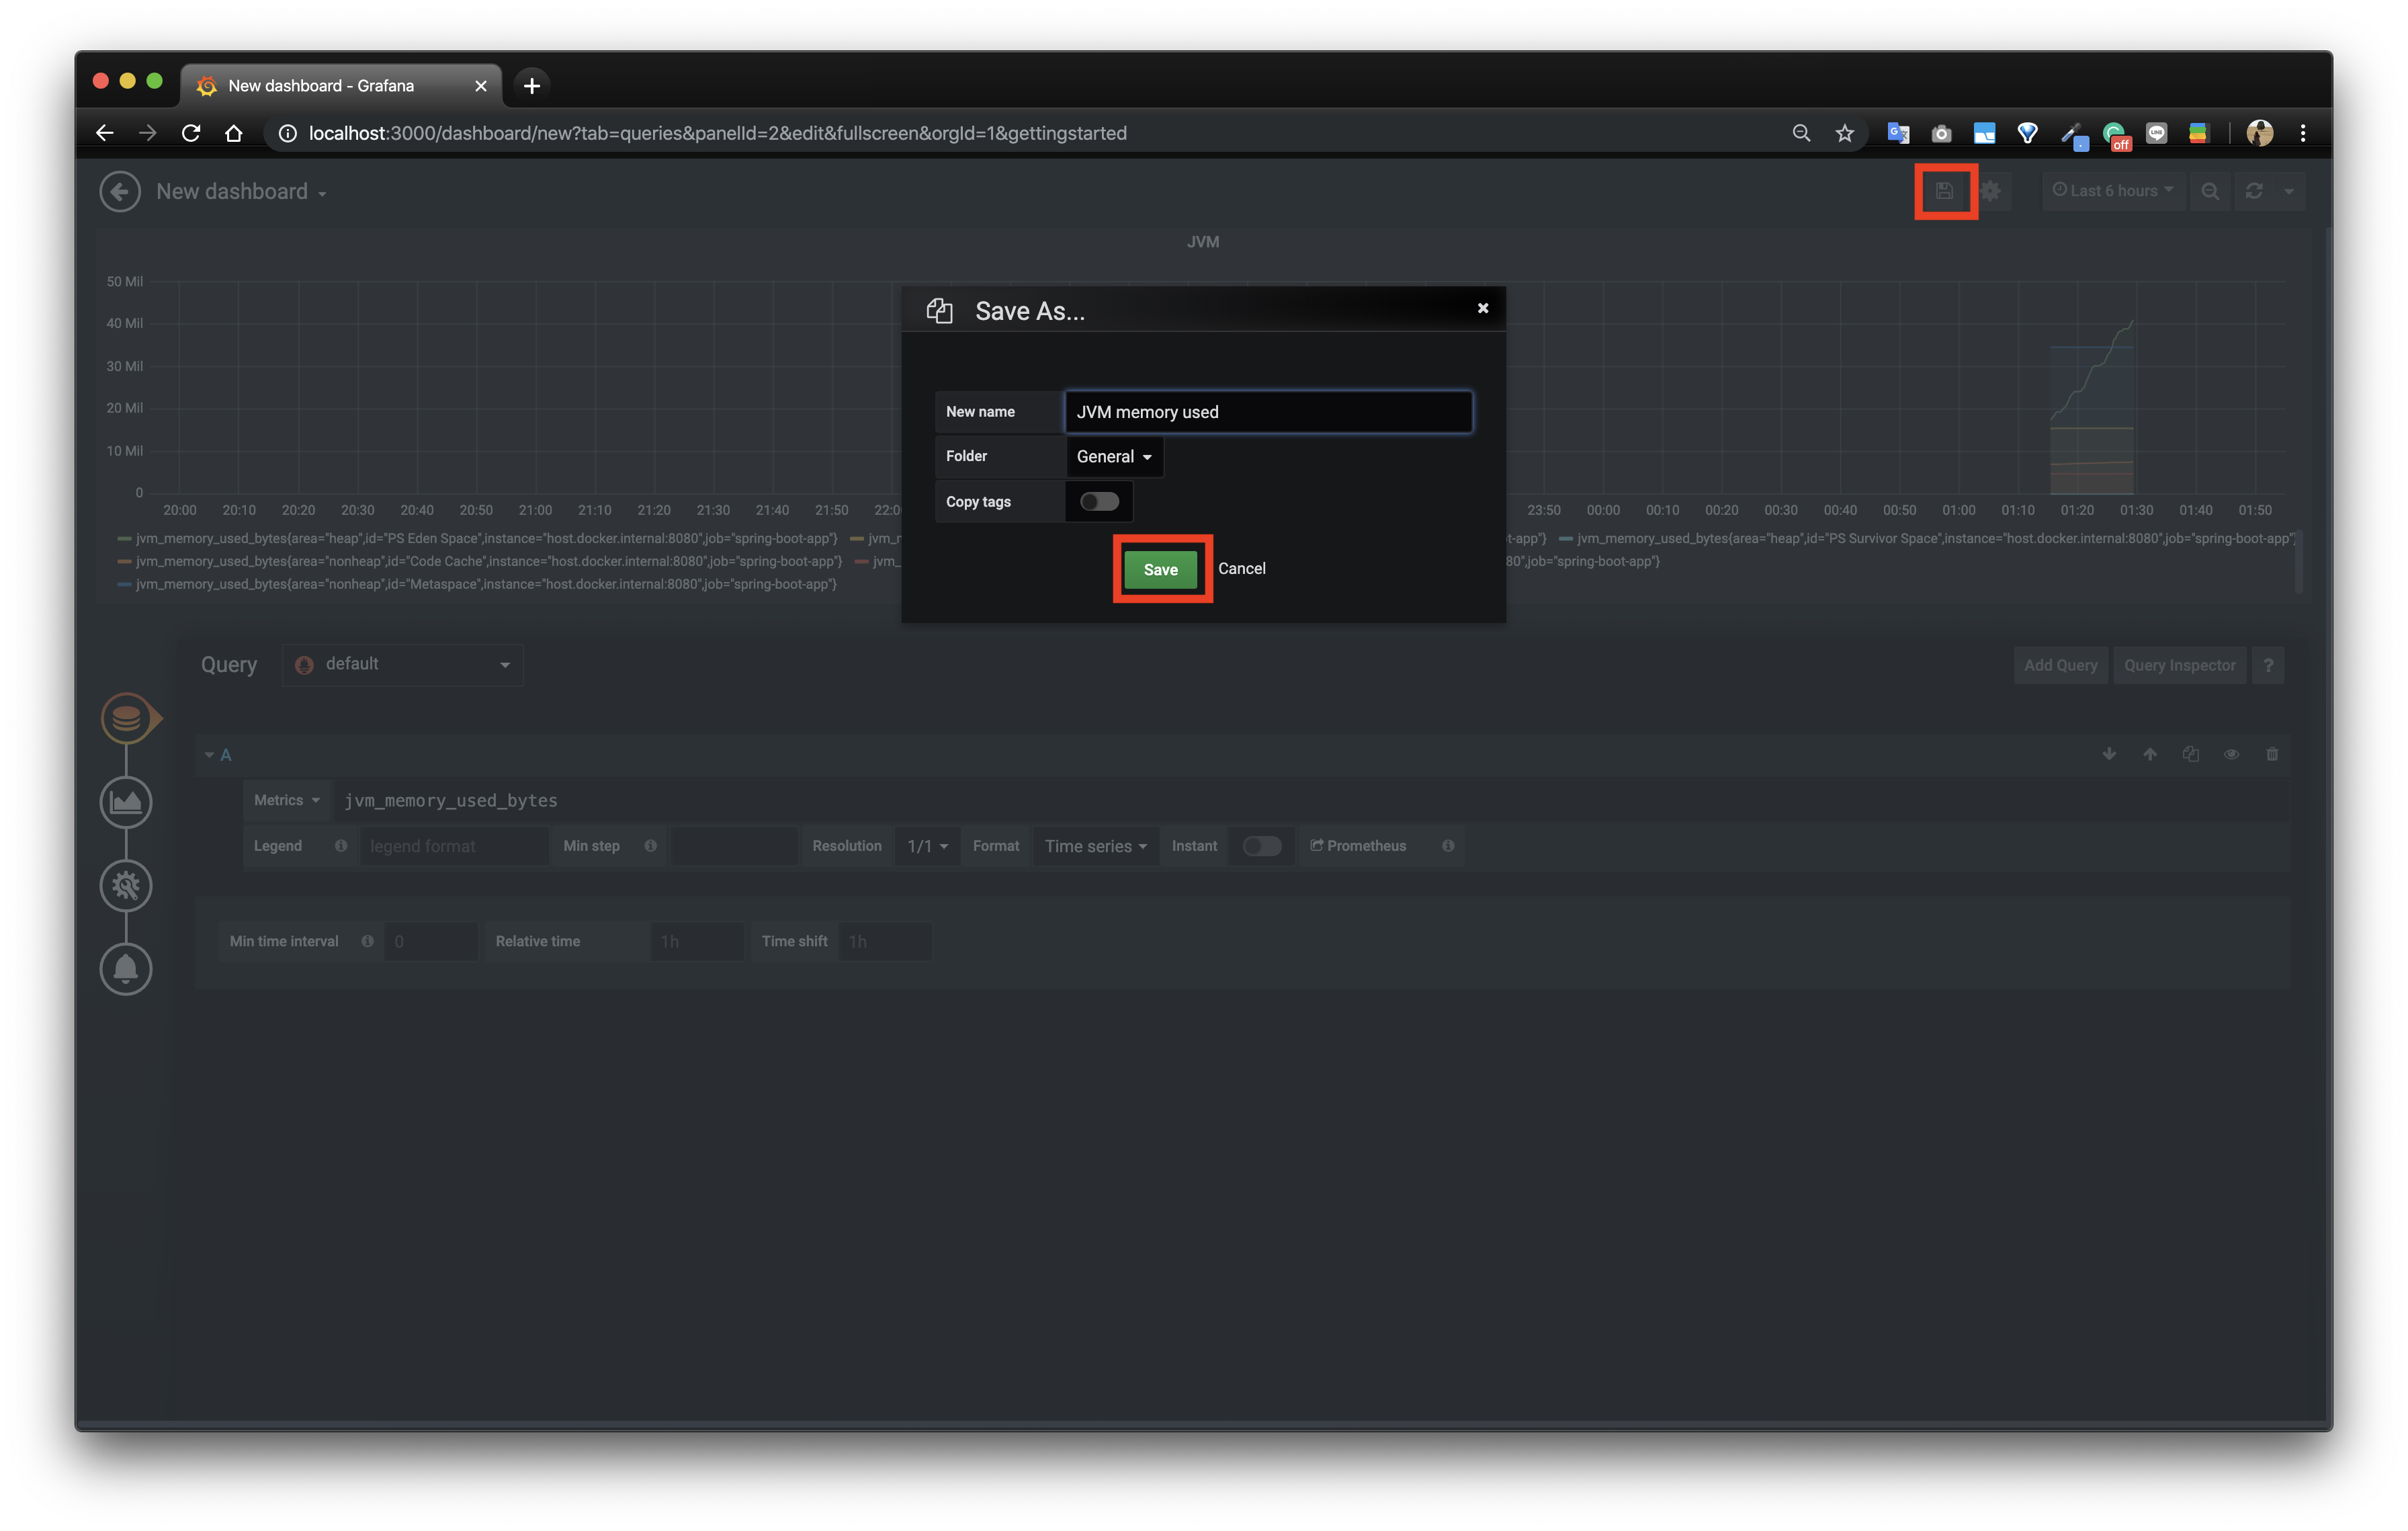
추가된 Dashboard를 확인할 수 있다.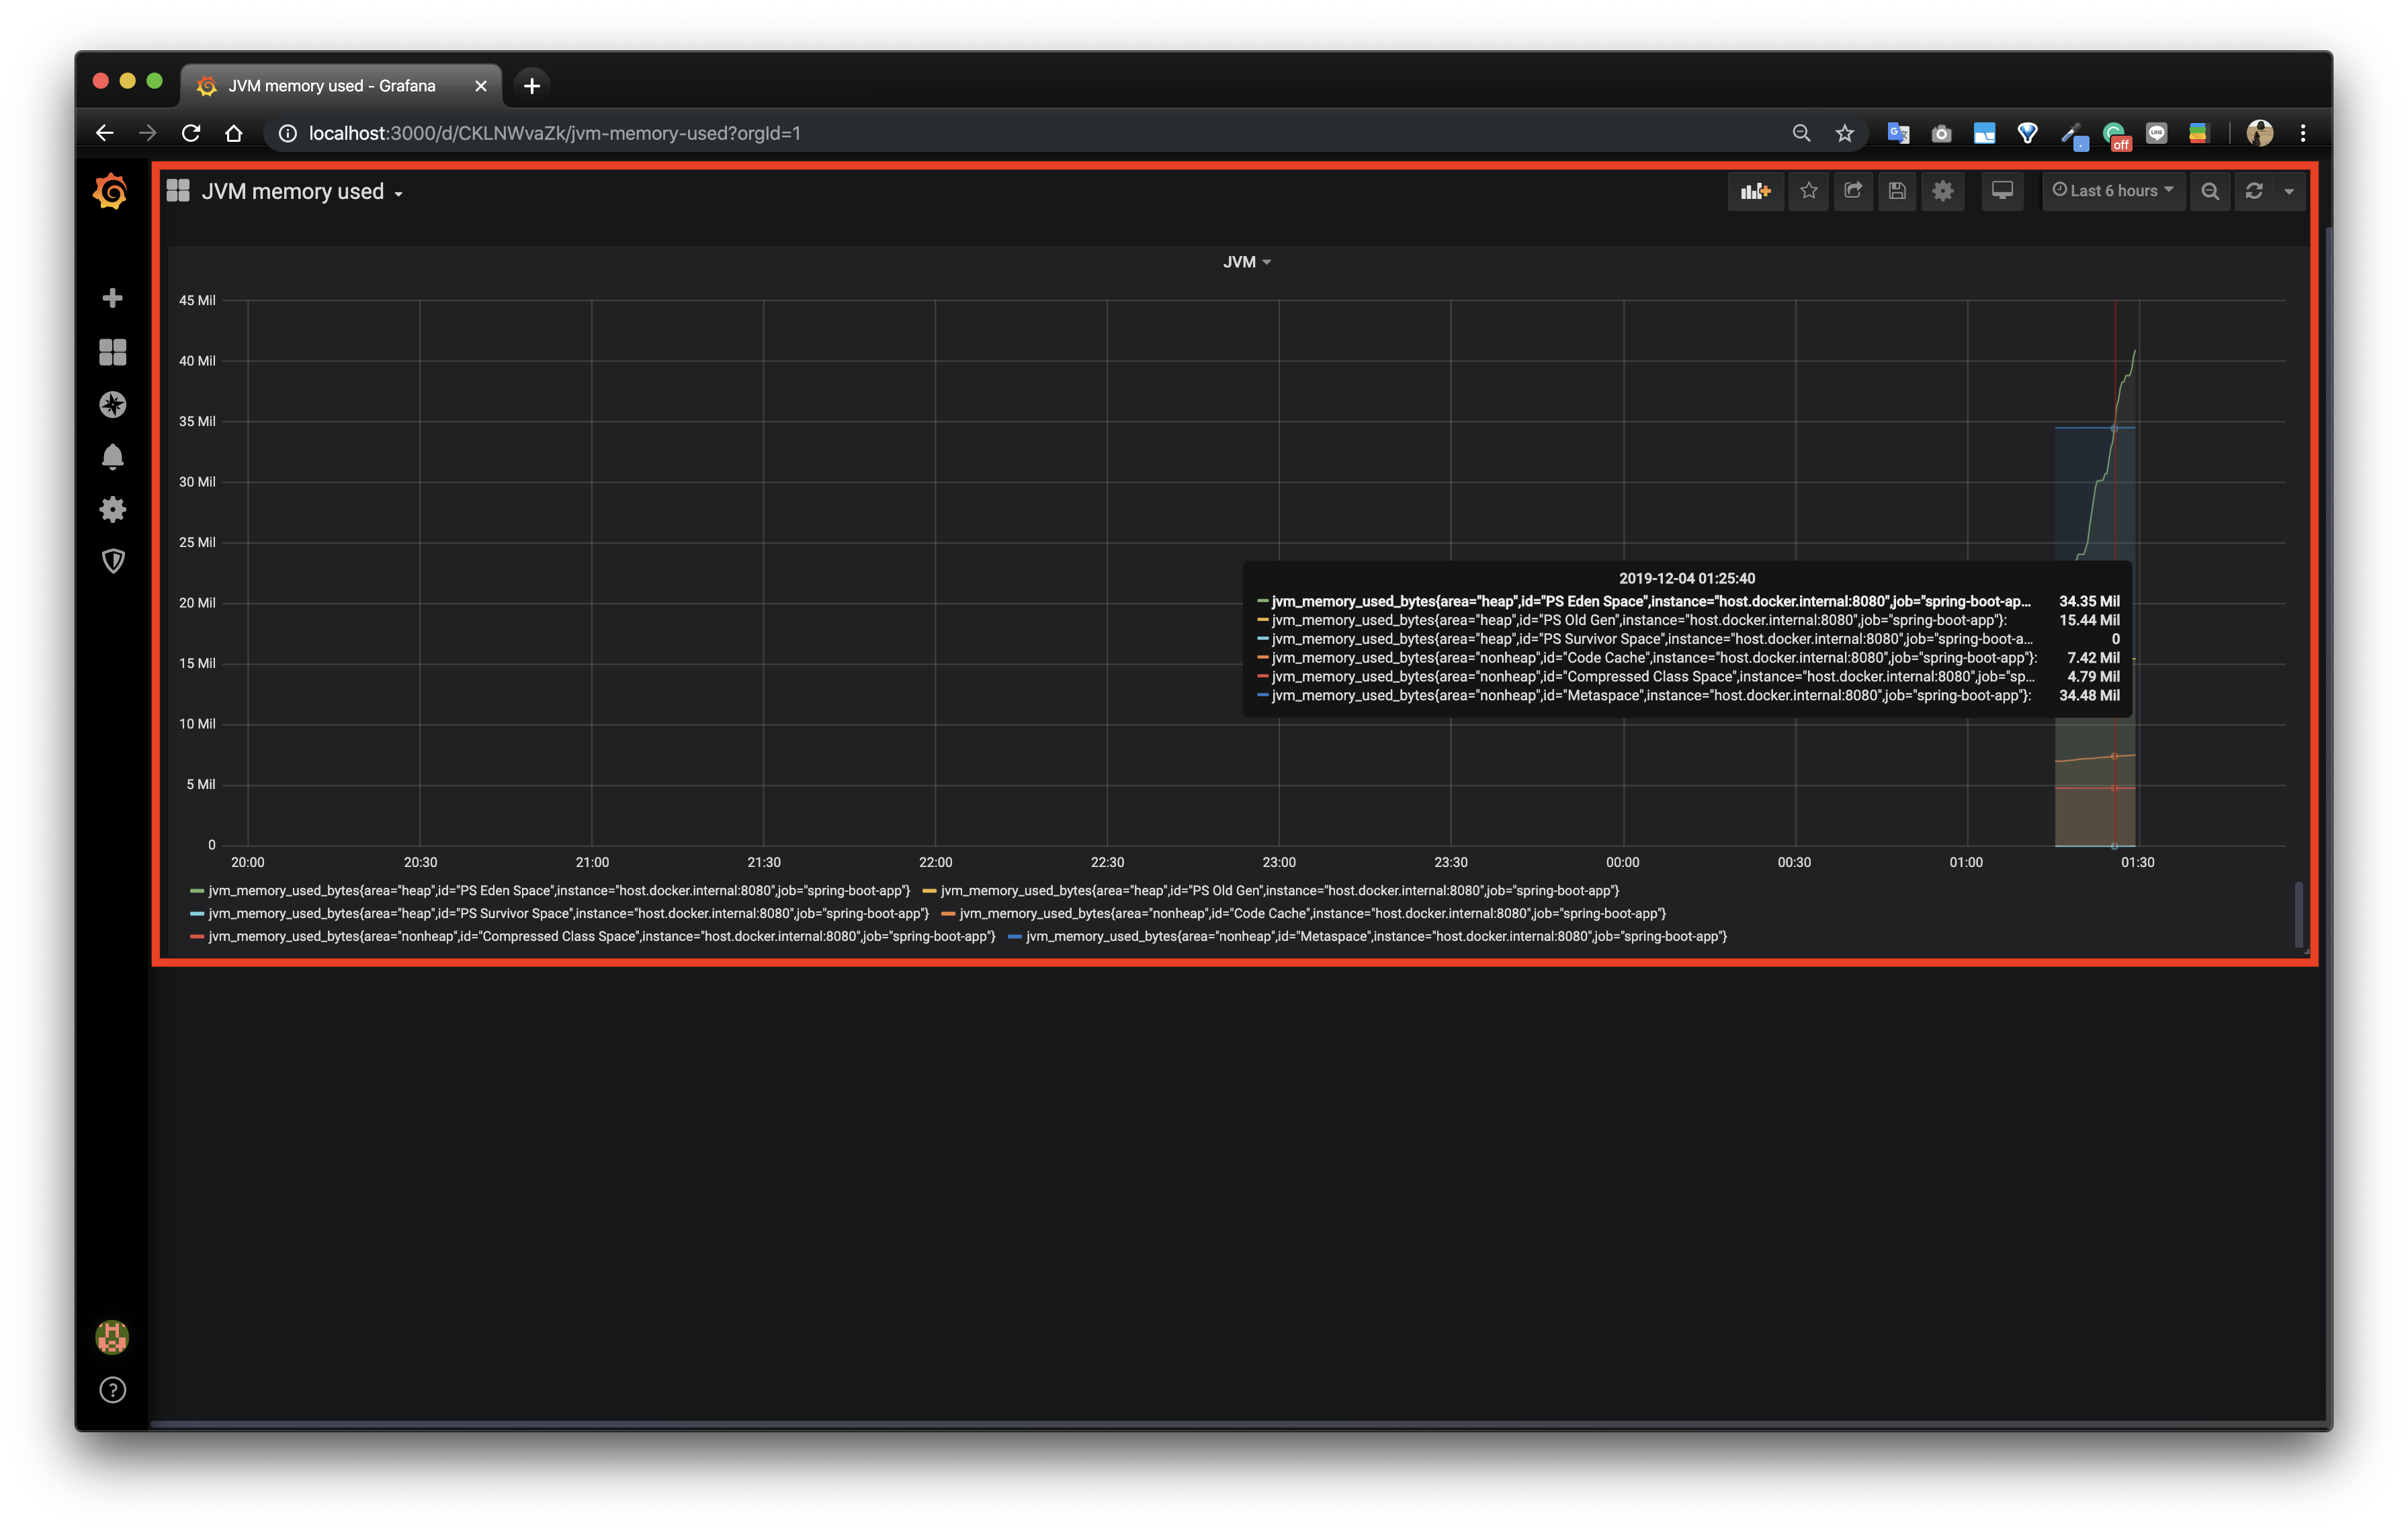
Spring Boot Application에서 생성하는 metric을 Prometheus를 통해 수집하고, Grafana로 시각화하는 것까지 마무리했다.
실제로는 애플리케이션에서 기본적으로 제공하는 Metric 뿐만 아니라 Micrometer를 이용해 직접 필요한 Metric을 추가할 수도 있다.
또한 Grafana에는 소개하지 않은 더 많은 유용한 기능들이 있다. 필요한 기능은 문서를 통해 찾아가며 사용해보자.
SpringBoot Application의 monitoring 시스템 구축하기